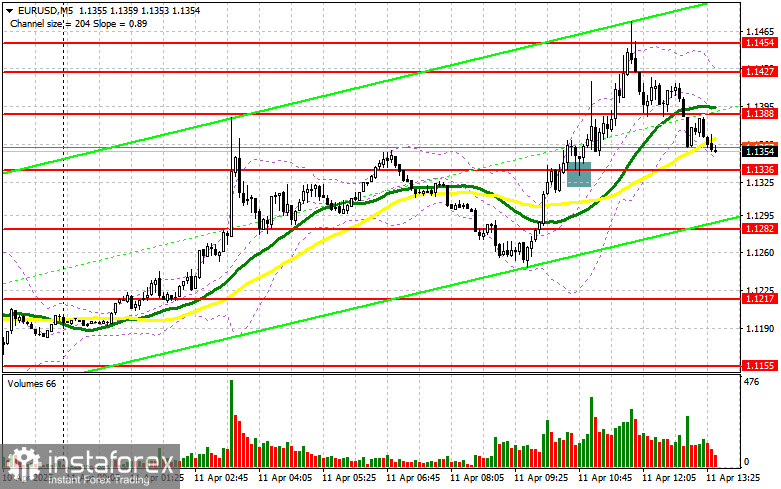
In my morning forecast, I focused on the 1.1336 level and planned to make market entry decisions based on it. Let's take a look at the 5-minute chart and analyze what happened. A breakout and subsequent retest of this range provided a strong buy signal for the euro, continuing the bullish trend observed since yesterday, which resulted in the pair rising by more than 100 points. The technical picture was revised for the second half of the day.
To Open Long Positions on EUR/USD:
During the U.S. session, data is expected on the Producer Price Index (PPI) for March, the University of Michigan Consumer Sentiment Index, and inflation expectations. FOMC member John Williams is also scheduled to speak. A decline in inflation will further weaken the dollar, boosting risk assets including the euro. However, if inflation rises, pressure will shift to the euro, potentially pushing the pair lower.
In that case, only a false breakout near the support at 1.1322 will serve as a reason to buy EUR/USD in anticipation of a continuation of the bullish market with a target of updating 1.1393. A breakout and retest of this range will confirm a proper entry point for long positions, targeting 1.1467, which is the yearly high. The ultimate target will be 1.1562, where I will take profit.
If EUR/USD declines and there is no activity around 1.1322, pressure on the euro may intensify by the end of the week. In this scenario, bears may push the pair down to 1.1253. I will only consider buying after a false breakout forms at that level. I also plan to open long positions on a rebound from 1.1167, targeting an intraday upward correction of 30–35 points.
To Open Short Positions on EUR/USD:
If U.S. inflation data indicates easing price pressures, sellers—just like yesterday—will struggle. Only a false breakout around 1.1393 will offer an opportunity for short positions with a target of pulling the pair down to the support at 1.1322, which was formed earlier today. A breakout and consolidation below this range would be a valid signal for selling, targeting 1.1253. The ultimate downward target will be 1.1167, where I plan to lock in profits.
If EUR/USD makes another move up during the second half of the day and bears remain inactive near 1.1393, buyers may return to weekly highs. In this case, I'll wait for the next resistance at 1.1467 to be tested. I'll only sell there after an unsuccessful consolidation. If there's no downward movement even at that level, I'll look for short entries at 1.1562, expecting a 30–35 point intraday correction.
COT (Commitment of Traders) Report:
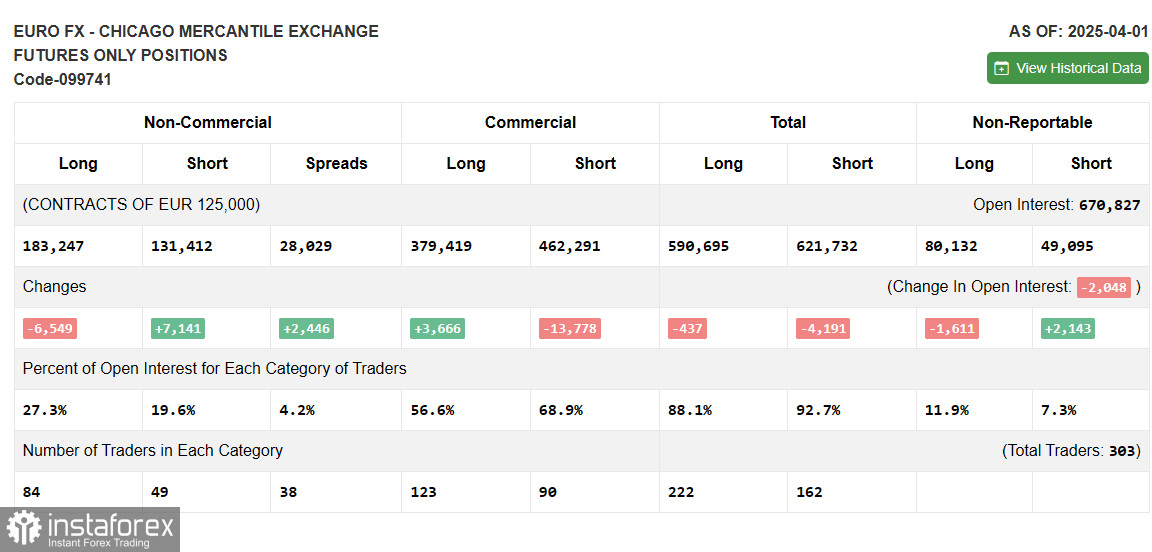
The COT report for April 1 showed a slight increase in short positions and a decrease in long positions. However, this report doesn't take into account the new U.S. trade tariffs on key partners or the latest March U.S. labor market data. Therefore, detailed analysis of the changes in positions is not very meaningful, as it does not reflect the current reality.
According to the report, long non-commercial positions fell by 6,549 to 183,247 and short non-commercial positions rose by 7,141 to 131,412. The gap between long and short positions widened by 2,466.
Indicator Signals:
Moving Averages:
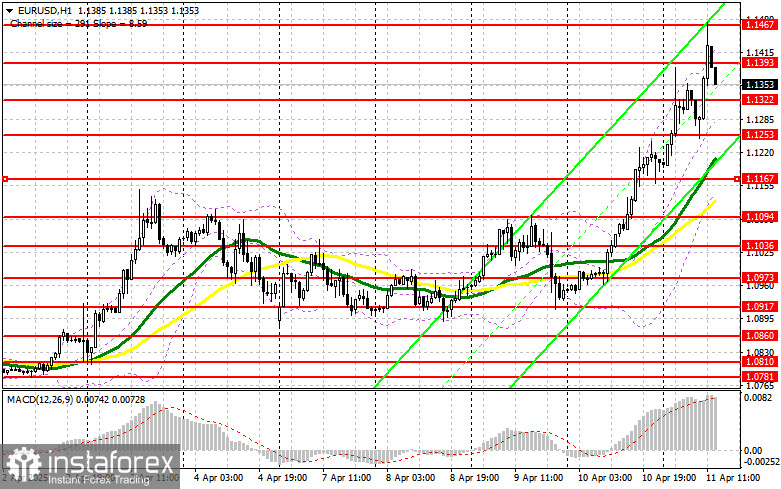
Trading is taking place above the 30- and 50-day moving averages, indicating euro buyers remain in control.
Note: The author analyzes moving averages on the H1 (hourly) chart, which differs from traditional definitions on the D1 (daily) chart.
Bollinger Bands:
In case of a decline, the lower boundary of the indicator near 1.1167 will serve as support.
Indicator Descriptions:
- Moving average – smooths out volatility and noise to show the current trend.
- 50-period = yellow line
- 30-period = green line
- MACD (Moving Average Convergence/Divergence)
- Fast EMA: 12
- Slow EMA: 26
- Signal SMA: 9
- Bollinger Bands – measures market volatility.
- Non-commercial traders – speculators such as individual traders, hedge funds, and large institutions using the futures market for speculative purposes and meeting specific requirements.
- Long non-commercial positions – total long open positions held by non-commercial traders.
- Short non-commercial positions – total short open positions held by non-commercial traders.
- Net non-commercial position – the difference between short and long positions held by non-commercial traders.