Analysis of Wednesday's Trades
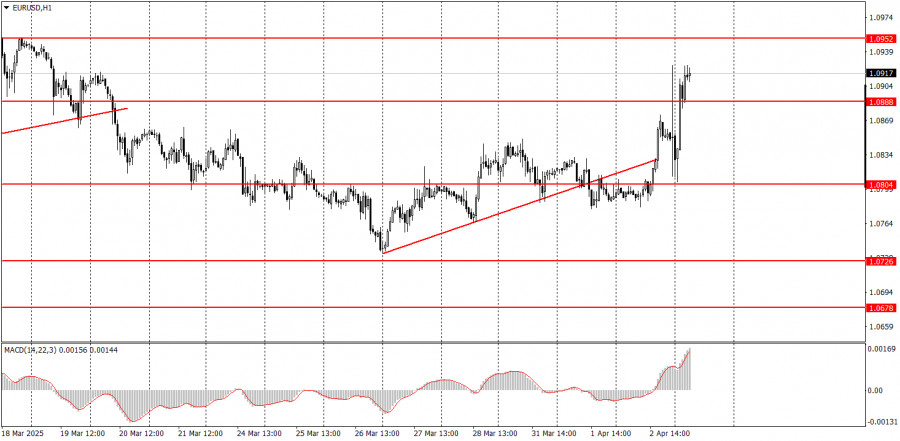
1H Chart of EUR/USD
The EUR/USD currency pair traded with gains on Wednesday, though this had nothing to do with the macroeconomic backdrop. The U.S. dollar began weakening again during the American trading session, and the market likely started to sense something very negative coming from Trump. As it turned out, that feeling was entirely justified. It's worth noting that we did not expect Trump to impose such sweeping and high tariffs. We had assumed they would be capped at around 10–15%. However, Trump has imposed tariffs on imports from almost every country globally, and in some cases, the rates are approaching 100%. Therefore, the overnight "storm" across markets is hardly surprising.
The U.S. dollar is again plunging, and the market shows how it views Trump's initiative to "Make America Great Again." The technical picture on higher timeframes is starting to break down, as no one could have foreseen the onset of a global trade war a few months ago. We should expect retaliatory measures from countries affected by Trump's actions. We should also expect a new wave of declines in the U.S. stock market, a sell-off in U.S. Treasuries, and rising yields. The formation of trade alliances against the U.S. is also possible. In short, 2025 continues to surprise us with new shocks.
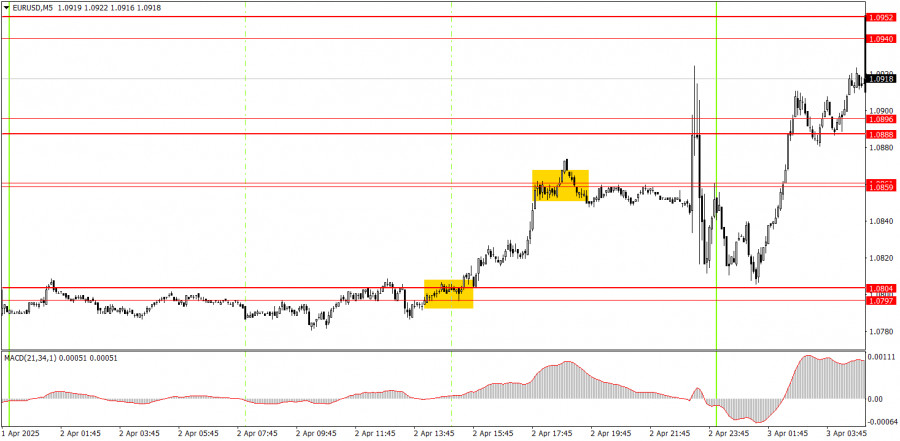
5M Chart of EUR/USD
On the 5-minute timeframe on Wednesday, two trading signals were formed. It's worth noting that there were virtually no market movements before the U.S. session began. The "takeoff" started in the second half of the day, while we saw near-parabolic movements by night. Thus, novice traders could only attempt to work with the signal on the breakout of the 1.0797–1.0804 zone, after which the 1.0859–1.0861 area was reached and processed.
Trading Strategy for Thursday:
On the hourly timeframe, the EUR/USD pair remains in a medium-term downtrend, but the chances of that trend resuming are dwindling. At this point, fundamental and macroeconomic factors have no weight. Only political and geopolitical developments matter. Trump has been imposing tariffs for two months now, and that alone is driving the dollar downward. Now, other countries may begin to impose tariffs on U.S. exports, and Trump has already promised to respond with even more tariffs to any countermeasures.
On Thursday, all markets will be in a state of shock. We're not even going to attempt forecasting movements, and the economic calendar can be ignored—it holds no relevance at this point. The coming days will be important in terms of the global response to the U.S.'s new trade policy.
On the 5-minute chart, the levels to watch are: 1.0433–1.0451, 1.0526, 1.0596, 1.0678, 1.0726–1.0733, 1.0797–1.0804, 1.0859–1.0861, 1.0888–1.0896, 1.0940–1.0952, 1.1011, 1.1048.
On Thursday, we won't highlight any key macroeconomic events. Today and tomorrow, the market will closely watch how countries respond to Trump's sweeping tariff measures.
Core Trading System Rules:
- Signal Strength: The shorter the time it takes for a signal to form (a rebound or breakout), the stronger the signal.
- False Signals: If two or more trades near a level result in false signals, subsequent signals from that level should be ignored.
- Flat Markets: In flat conditions, pairs may generate many false signals or none at all. It's better to stop trading at the first signs of a flat market.
- Trading Hours: Open trades between the start of the European session and the middle of the US session, then manually close all trades.
- MACD Signals: On the hourly timeframe, trade MACD signals only during periods of good volatility and a clear trend confirmed by trendlines or trend channels.
- Close Levels: If two levels are too close (5–20 pips apart), treat them as a support or resistance zone.
- Stop Loss: Set a Stop Loss to breakeven after the price moves 15 pips in the desired direction.
Key Chart Elements:
Support and Resistance Levels: These are target levels for opening or closing positions and can also serve as points for placing Take Profit orders.
Red Lines: Channels or trendlines indicating the current trend and the preferred direction for trading.
MACD Indicator (14,22,3): A histogram and signal line used as a supplementary source of trading signals.
Important Events and Reports: Found in the economic calendar, these can heavily influence price movements. Exercise caution or exit the market during their release to avoid sharp reversals.
Forex trading beginners should remember that not every trade will be profitable. Developing a clear strategy and practicing proper money management are essential for long-term trading success.


