EUR/USD 5-Minute Analysis
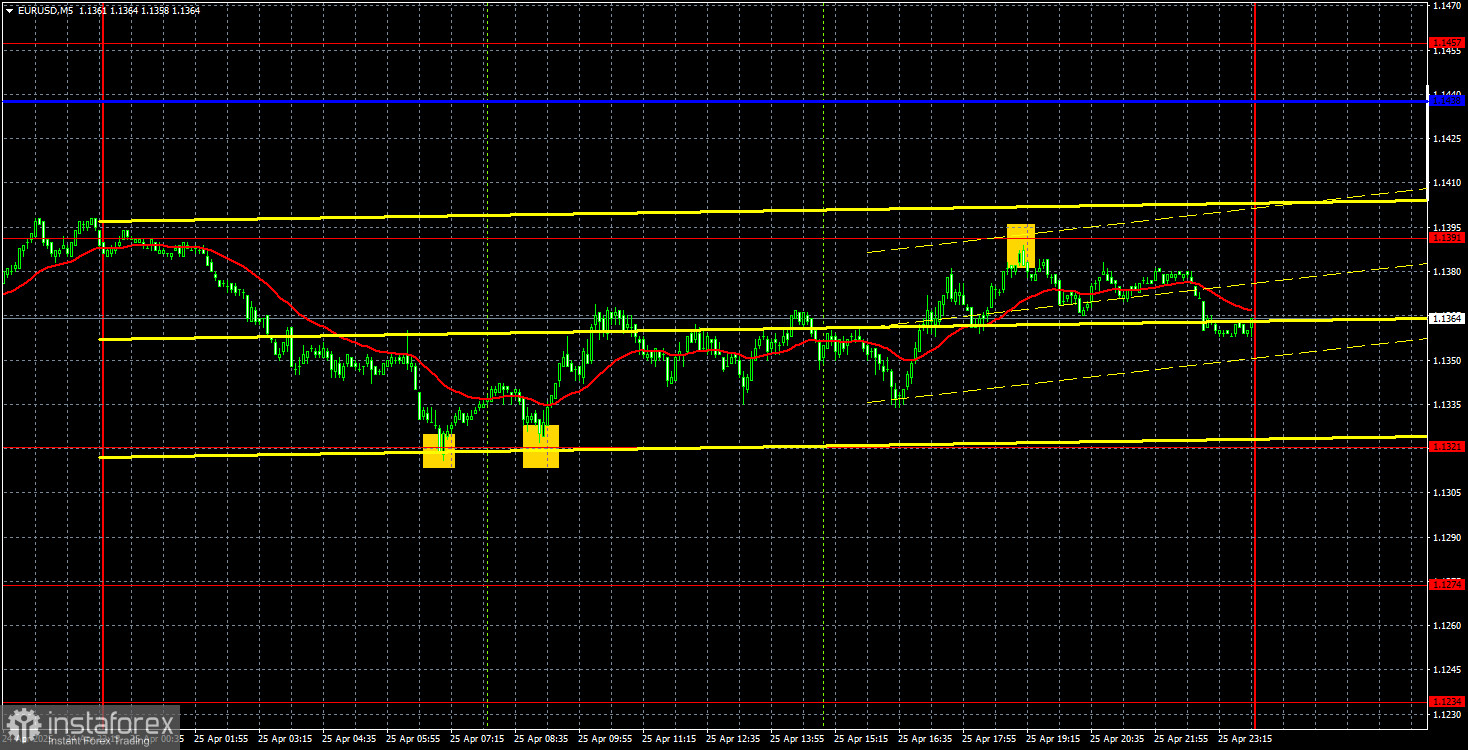
The EUR/USD currency pair continued trading sideways throughout Friday. In the second half of last week, the euro traded exclusively between the levels of 1.1321 and 1.1391, although the overall sideways channel could be outlined between 1.1274 and 1.1457. Let me remind you that we prefer not to pay attention to the movements on Monday and Tuesday of last week because, in essence, they should not have happened at all. Even if we imagine for a moment that Trump could have fired Powell (although that's impossible), he backed down from the idea the very next day. Consequently, we believe the pair has been in a flat since April 11. And it remains in this flat because Trump has stopped introducing and raising import tariffs.
There is no point in reviewing Friday's macroeconomic background. The market continues to ignore almost all reports. Last week, the most important report on U.S. durable goods orders showed a 9% increase, but the dollar did not react. Therefore, Friday's University of Michigan Consumer Sentiment Index had no chance of significantly influencing anything.
Recently, we have observed that the market is trading very erratically and that technical levels are being processed ineffectively. However, on Friday, the price rebounded twice perfectly from the 1.1321 level and, by the end of the day, worked through the 1.1391 level. Thus, traders could open long positions in the morning and close them in the evening. The profit on the trade could have been about 50 pips.
COT Report
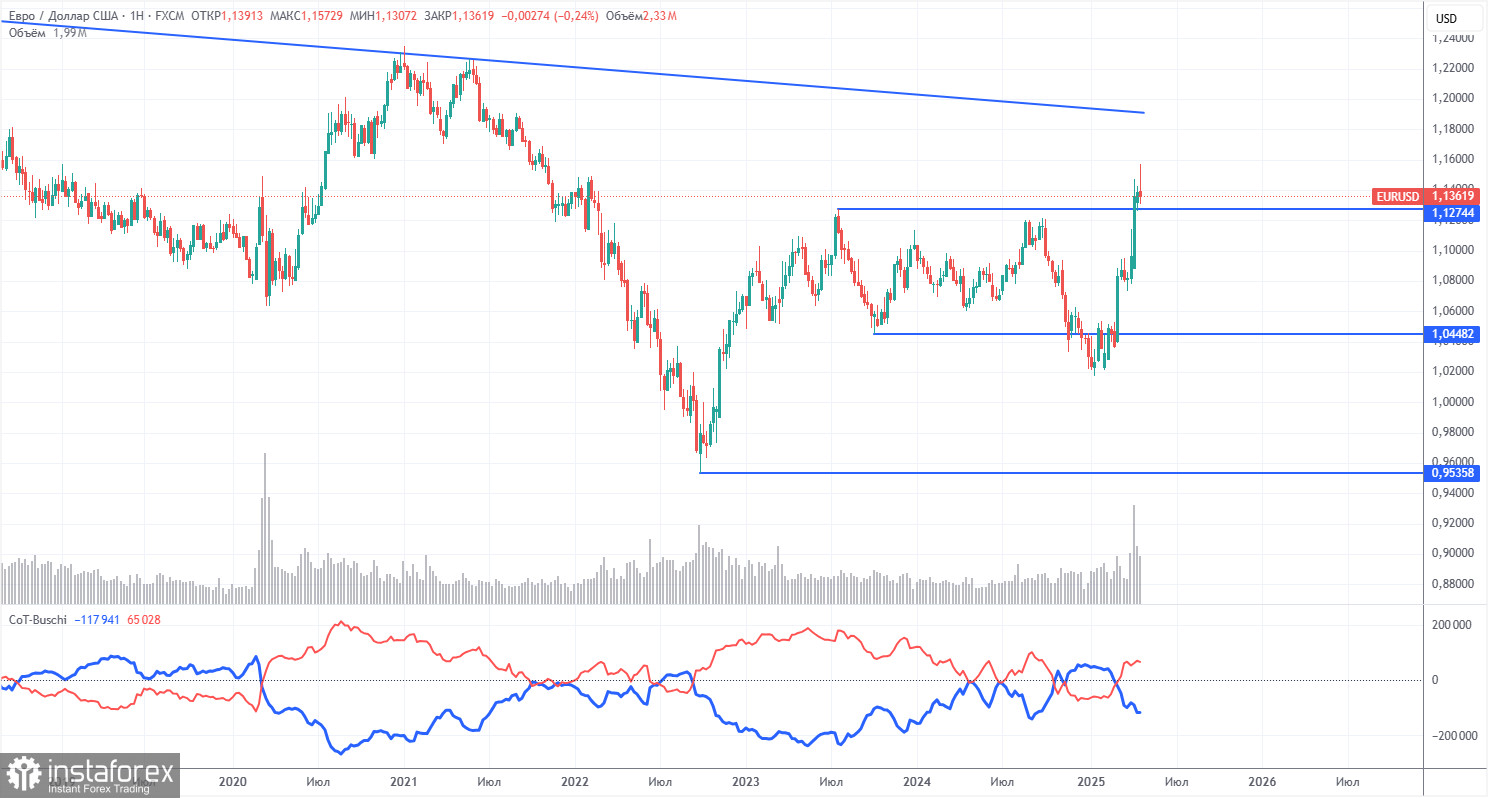
As shown in the chart above, the net position of non-commercial traders remained bullish for a long time. The bears barely managed to move into dominance but quickly lost it. Since Trump took office as U.S. President, the dollar has fallen into an abyss.
We cannot definitively say that the decline of the American currency will continue, and the COT reports reflect the true sentiment of major players, which can also change very quickly in the current circumstances.
We still do not see any fundamental factors for strengthening the European currency, but one very significant factor remains for the fall of the U.S. dollar. The pair may correct for a few more weeks or months, but a 16-year downtrend won't be reversed so quickly.
The red and blue lines have crossed again, so the trend in the market is now bullish once more. Over the last reporting week, the number of longs from the "Non-commercial" group decreased by 900, and the number of shorts increased by 3,300. Accordingly, the net position decreased by 4,200 contracts.
EUR/USD 1-Hour Analysis
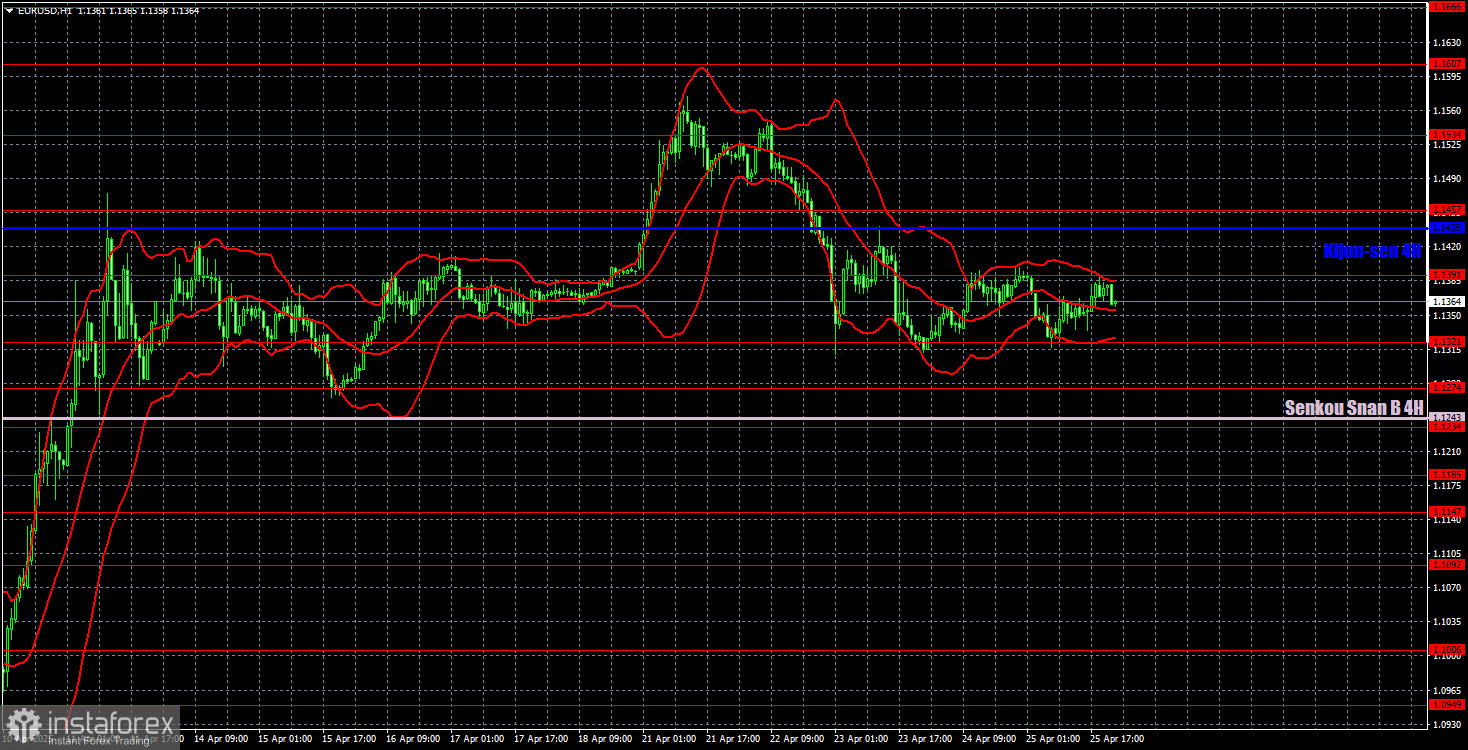
On the hourly timeframe, the EUR/USD pair maintains an upward trend but has been trading flat for the past few weeks due to the absence of news on Trump's trade issues. It can officially be declared on the daily timeframe that the downtrend has been canceled. This would never have happened if Trump had not started a trade war with the entire world. Thus, the fundamental background has broken the technical picture, which rarely happens but does happen. There is very little logic and technicality in movements at any timeframe right now, and macroeconomic data has no real impact on the pair's movement.
For April 28, we highlight the following levels for trading — 1.0823, 1.0886, 1.0949, 1.1006, 1.1092, 1.1147, 1.1185, 1.1234, 1.1274, 1.1321, 1.1391, 1.1474, 1.1607, 1.1666, as well as the Senkou Span B line (1.1243) and the Kijun-sen line (1.1438). The Ichimoku indicator lines may shift during the day, which should be considered when determining trading signals. Don't forget to set your Stop Loss order to break even if the price moves 15 pips in the correct direction — this will protect against possible losses if the signal turns out to be false.
No significant events or reports are scheduled in the European Union or the United States for Monday, but it should be remembered that Trump can still provoke a new "storm" with his decisions. Even a simple statement from the U.S. president could trigger a strong market movement, as we observed at last week's beginning.
Illustration Explanations:
- Support and resistance price levels – thick red lines where movement may end. They are not trading signal sources.
- Kijun-sen and Senkou Span B lines—These are strong Ichimoku indicator lines transferred to the hourly timeframe from the 4-hour one.
- Extremum levels – thin red lines where the price has previously rebounded. These act as trading signal sources.
- Yellow lines – trend lines, trend channels, and other technical patterns.
- COT Indicator 1 on the charts – the size of the net position for each category of traders.