Analysis of Wednesday's Trades
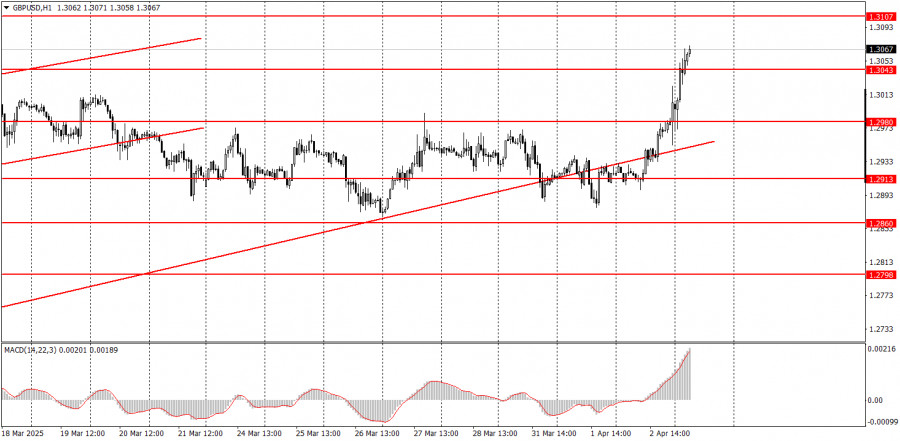
1H Chart of GBP/USD
On Wednesday, the GBP/USD pair surged by 160 pips and continues its rapid upward movement. Let us reiterate: we did not expect Donald Trump to impose tariffs on all countries globally, mainly with rates for selected nations ranging from 20% to 100%. Frankly, very few anticipated such harsh measures. No one in the world can predict Trump's actions. Accordingly, no one can forecast how the market will respond to any specific Trump decision, as those decisions are inherently unpredictable. Traders should now brace for prolonged negotiations between the U.S. and the countries buried in tariffs. Strong nations will retaliate; weaker ones will seek compromise. Global trade architecture will begin to shift—trade alliances will be formed, countermeasures will be introduced, and counter-countermeasures will follow. At this point, macroeconomic and fundamental factors are irrelevant.
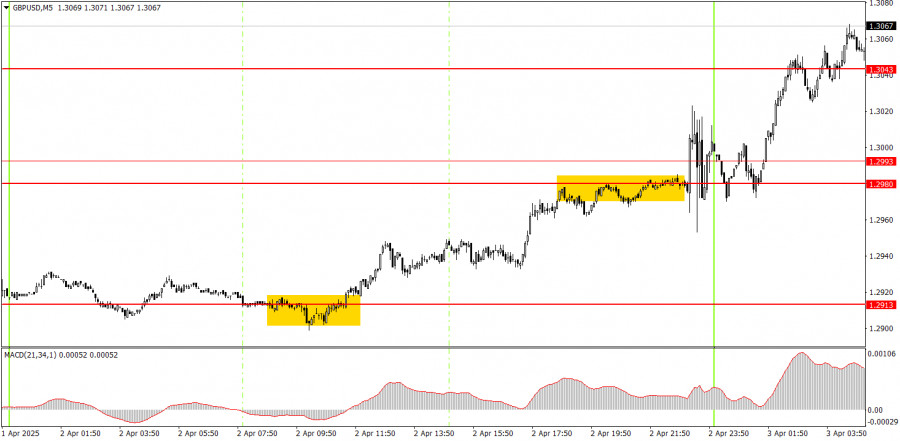
5M Chart of GBP/USD
On the 5-minute timeframe Wednesday, a buy signal formed during the European session, but its quality and accuracy left much to be desired. It's important to remember that the British pound had been trading in a tight flat for nearly a month, so strong signals were nothing but wishful thinking during that time. And on Wednesday morning, the flat range was still intact. During the day, the pair rose to the 1.2860 level, which was previously considered the upper boundary of the sideways channel. Then, after Trump published the list of countries subject to trade tariffs, the market experienced sharp movements. It would be easier to list the countries that didn't make it onto that list.
Trading Strategy for Thursday:
On the hourly timeframe, GBP/USD should have long since entered a downward trend, but Trump continues to do everything in his power to prevent that from happening. Now that the global trade war has officially begun, we will not attempt to predict long-term movements of currency pairs. It is best to trade using lower timeframes, where trends and reversals can be tracked more quickly. However, we caution traders that the currency market is now at the mercy of politics. Retaliatory measures against the U.S. could trigger significant market moves.
On Thursday, the GBP/USD pair will likely continue to rise. What else can be expected from the U.S. dollar now except further decline? We had assumed that the market had already priced in all of Trump's tariffs and had lost interest in the topic, but the American president once again managed to shock the markets—and this clearly won't be the last time.
On the 5-minute timeframe, you can currently trade using the following levels: 1.2301, 1.2372–1.2387, 1.2445, 1.2502–1.2508, 1.2547, 1.2613, 1.2680–1.2685, 1.2723, 1.2791–1.2798, 1.2848–1.2860, 1.2913, 1.2980–1.2993, 1.3043, 1.3102–1.3107.
Business activity indices are scheduled for release in the UK and the U.S. on Thursday, but they will be irrelevant to traders who are still quietly horrified by recent developments.
Core Trading System Rules:
- Signal Strength: The shorter the time it takes for a signal to form (a rebound or breakout), the stronger the signal.
- False Signals: If two or more trades near a level result in false signals, subsequent signals from that level should be ignored.
- Flat Markets: In flat conditions, pairs may generate many false signals or none at all. It's better to stop trading at the first signs of a flat market.
- Trading Hours: Open trades between the start of the European session and the middle of the US session, then manually close all trades.
- MACD Signals: On the hourly timeframe, trade MACD signals only during periods of good volatility and a clear trend confirmed by trendlines or trend channels.
- Close Levels: If two levels are too close (5–20 pips apart), treat them as a support or resistance zone.
- Stop Loss: Set a Stop Loss to breakeven after the price moves 20 pips in the desired direction.
Key Chart Elements:
Support and Resistance Levels: These are target levels for opening or closing positions and can also serve as points for placing Take Profit orders.
Red Lines: Channels or trendlines indicating the current trend and the preferred direction for trading.
MACD Indicator (14,22,3): A histogram and signal line used as a supplementary source of trading signals.
Important Events and Reports: Found in the economic calendar, these can heavily influence price movements. Exercise caution or exit the market during their release to avoid sharp reversals.
Forex trading beginners should remember that not every trade will be profitable. Developing a clear strategy and practicing proper money management are essential for long-term trading success.


