The GBP/USD currency pair continued its upward movement on Monday. As with the euro, there was no specific reason for the pair to decline. Of course, the current rally looks increasingly excessive and often illogical as the market continues to price in only one theme — the U.S. trade war against the rest of the world. All other factors are being disregarded. But at the same time, if the market is focused solely on the trade war and there have been no changes in that storyline, why should the U.S. dollar suddenly start to strengthen?
We've already pointed out that the technical picture on higher timeframes is now particularly interesting. Recall that the past 16 years have seen a downtrend — and that trend technically remains intact. However, we can't ignore that if developments continue in their current direction, that long-term trend could end. It's clear to most traders who the catalyst for this shift has been. Had Donald Trump not become president or hadn't launched a global trade war, the dollar would likely still be trading based on its long-term trends — steadily gaining against the euro, pound, yen, and others. However, Trump has managed to turn the market in a direction that arguably benefits him.
Let's also recall that Trump already considered the dollar "too strong" eight years ago. During his first term, he repeatedly pressured Powell to cut interest rates almost to zero to devalue the U.S. currency — partly for this reason. Trump believes a "strong" dollar hurts American exports. But to what extent must the dollar fall for U.S. goods to gain a significant competitive advantage on the global stage?
Even if U.S. production increases significantly to compete with Chinese and European goods, a weak dollar must be sustained for years or even decades. Otherwise, all the newly established American businesses could quickly go bankrupt.
Back to the trade war: Over the weekend, Trump gave markets reason for optimism when he announced that mobile phones, various electronics, and a number of other goods would be exempt from tariffs. Then, on Monday, he walked back that decision, stating that nothing of the sort would happen. Do we even need to comment?
At this point, it seems that even if U.S. stocks or the dollar become attractive again for investors, many will still avoid them. Why? Because the sheer speed at which decisions are made — and then reversed — by the White House can make your head spin. Investors like stability. And what stability is there in the U.S. right now? Perhaps only the consistency of chaos.
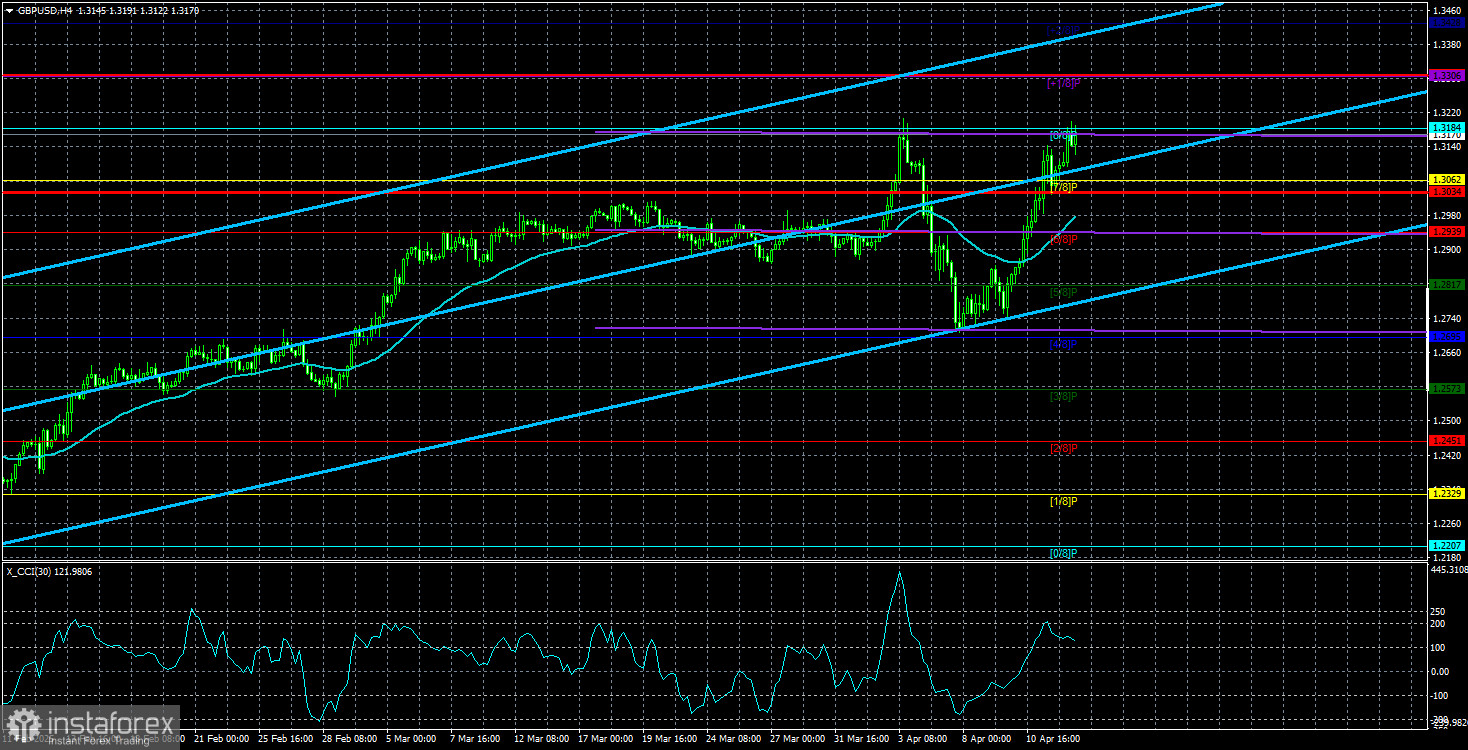
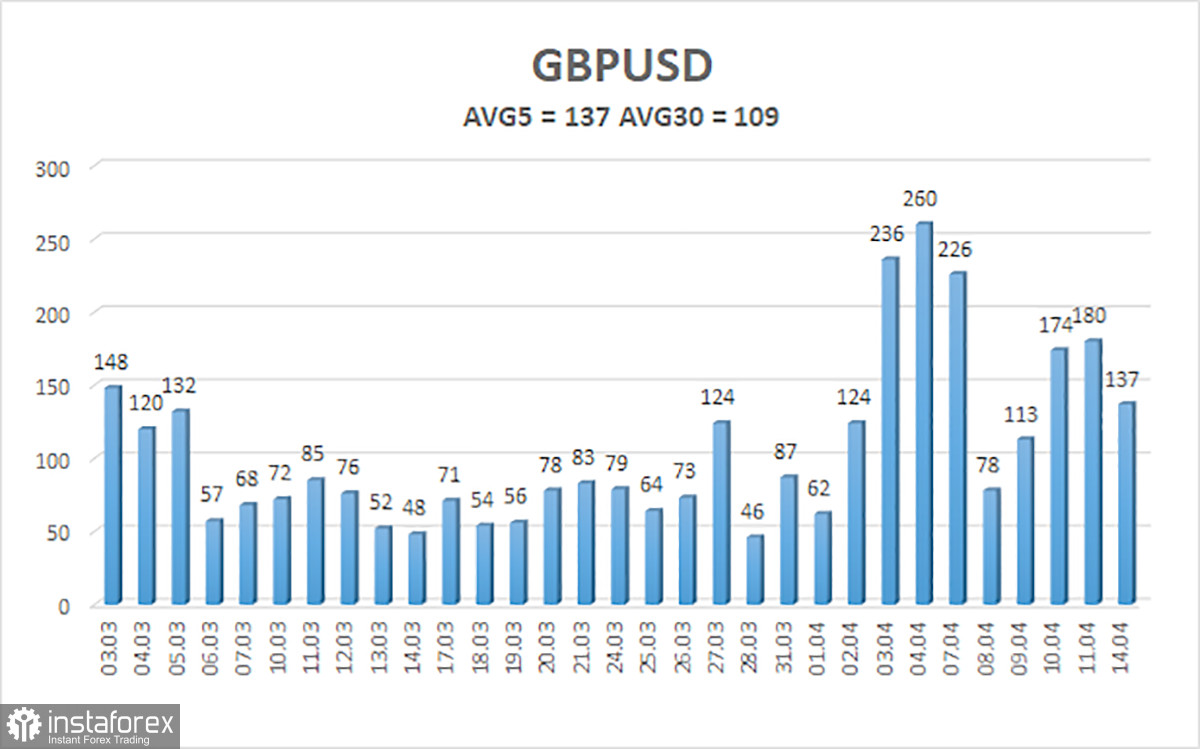
The average volatility of the GBP/USD pair over the past five trading days stands at 137 pips, which is considered high. Therefore, for Tuesday, April 15, we expect the pair to trade within a range defined by the levels 1.3034 to 1.3308. The long-term regression channel is still pointing upward, although a downward trend remains in place on the daily timeframe. The CCI indicator previously entered the overbought zone, signaling a downward pullback — but that correction appears to have concluded.
Nearest Support Levels:
S1 – 1.3062
S2 – 1.2939
S3 – 1.2817
Nearest Resistance Levels:
R1 – 1.3184
R2 – 1.3306
R3 – 1.3428
Trading Recommendations:
The GBP/USD pair has resumed its upward trend. We still do not recommend long positions, as we believe the entire move up is a correction on the daily timeframe that has already become increasingly irrational. However, if you're trading based on technical setups only or reacting to Trump-driven news, long positions remain relevant with targets at 1.3306 and 1.3428, as the price is currently positioned above the moving average.
Sell orders are still appealing, with targets at 1.2207 and 1.2146, because eventually, the bullish correction on the daily timeframe will end (unless, of course, the long-term downtrend ends first). However, with Trump practically introducing new tariffs every day, the dollar keeps falling.
Explanation of Illustrations:
Linear Regression Channels help determine the current trend. If both channels are aligned, it indicates a strong trend.
Moving Average Line (settings: 20,0, smoothed) defines the short-term trend and guides the trading direction.
Murray Levels act as target levels for movements and corrections.
Volatility Levels (red lines) represent the likely price range for the pair over the next 24 hours based on current volatility readings.
CCI Indicator: If it enters the oversold region (below -250) or overbought region (above +250), it signals an impending trend reversal in the opposite direction.