EUR/USD 5-Minute Analysis
The EUR/USD currency pair began a long-awaited decline on Tuesday, although it didn't fall very far or for very long. It's worth noting that there were no fundamental reasons for Tuesday's dollar growth, so what we saw was merely a corrective pullback. Let's recall that the U.S. dollar had fallen for almost three months, taking hits almost daily from Donald Trump and his new trade policy. However, things have been quiet at the White House lately—Trump hasn't imposed any new tariffs or raised existing ones for several days. As a result, the market seized the opportunity to lock in some profits from short dollar positions.
Any current rise in the dollar doesn't appear stable or solid. Market participants understand that Trump could announce new tariffs tomorrow, sending the dollar tumbling again. Regarding tariffs, the U.S. president is known for making abrupt announcements that shock the markets. So yes, the dollar may be oversold, but the market environment is so unstable and dependent on one individual that we cannot predict any sustained growth in the greenback.
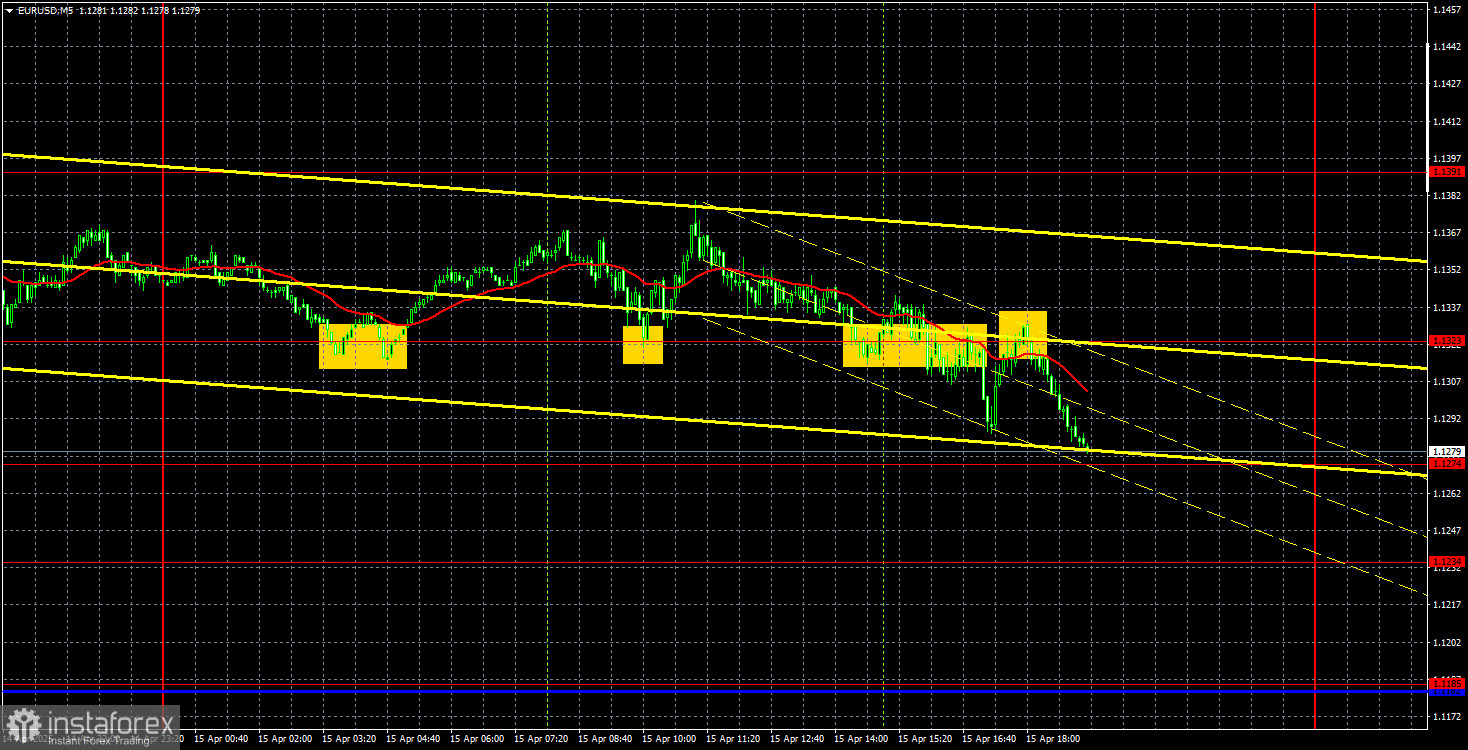
Three trading signals were formed in yesterday's 5-minute timeframe. The price bounced twice from the 1.1323 level, then broke through it and bounced again from below. In three out of four cases, target levels were not reached. The price continues to change direction frequently, and news affects the pair's movement in unpredictable ways—some events are ignored by the market, while others trigger sharp reactions. The current level of uncertainty and chaos in the market is off the charts.
COT Report
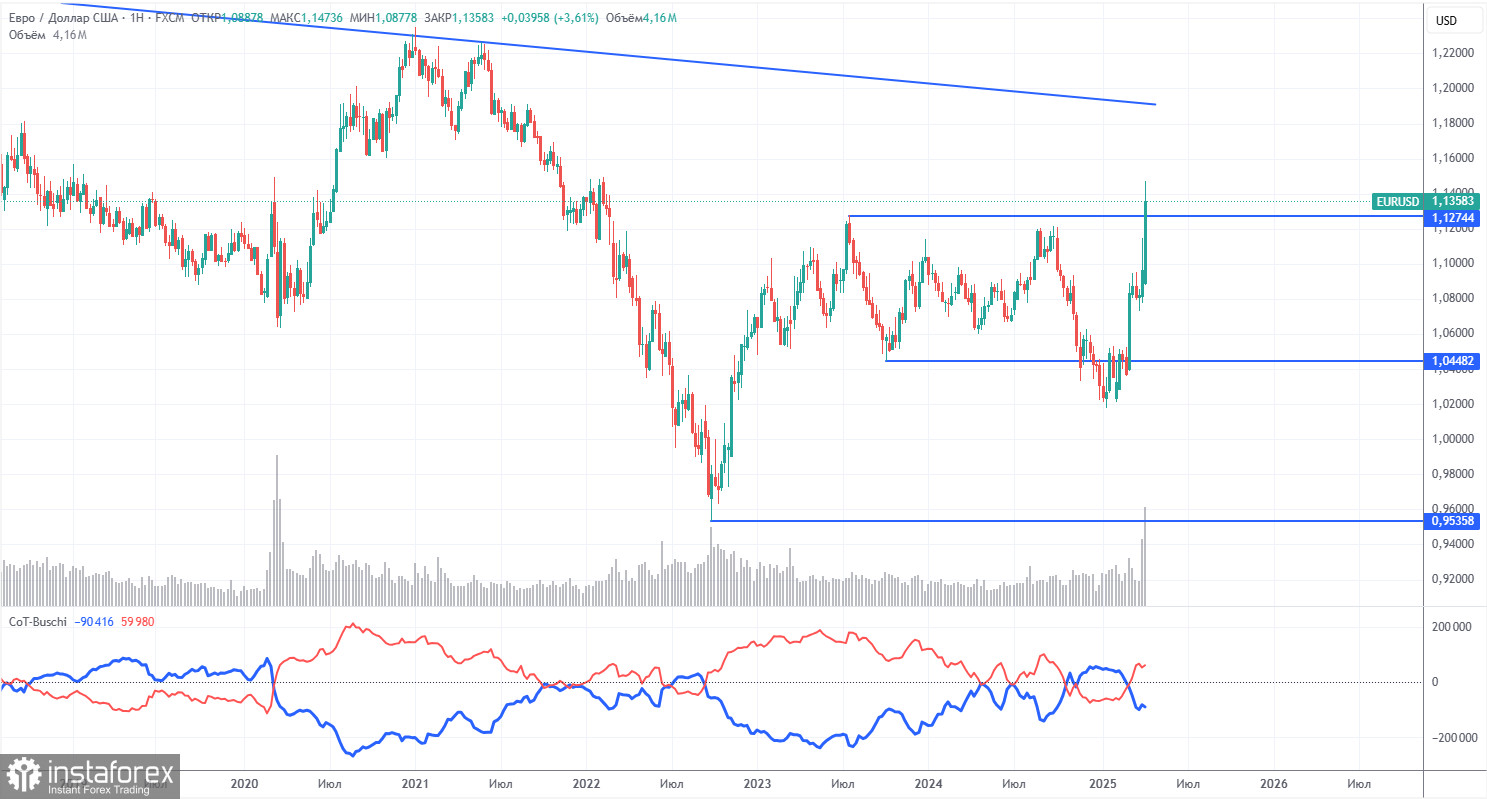
The latest COT report is dated April 8. As shown in the chart above, the net position of non-commercial traders remained in bullish territory for a long time. The bears barely managed to take control, but now bulls have regained the initiative. The bears' advantage has diminished since Trump took office, and the dollar has begun to fall.
We can't say with certainty that the dollar will continue to decline, and COT reports reflect the sentiment of large players, which can shift very quickly in the current circumstances.
We still don't see any fundamental factors supporting euro strength, but a major factor is now contributing to dollar weakness. The pair may correct for several more weeks or months, but a 16-year downward trend doesn't reverse overnight.
The red and blue lines have now crossed again, signaling a bullish trend. During the last reporting week, the number of long positions held by the "non-commercial" group increased by 7,000, while short positions dropped by 1,100—resulting in a net increase of 8,100 contracts.
EUR/USD 1-Hour Analysis
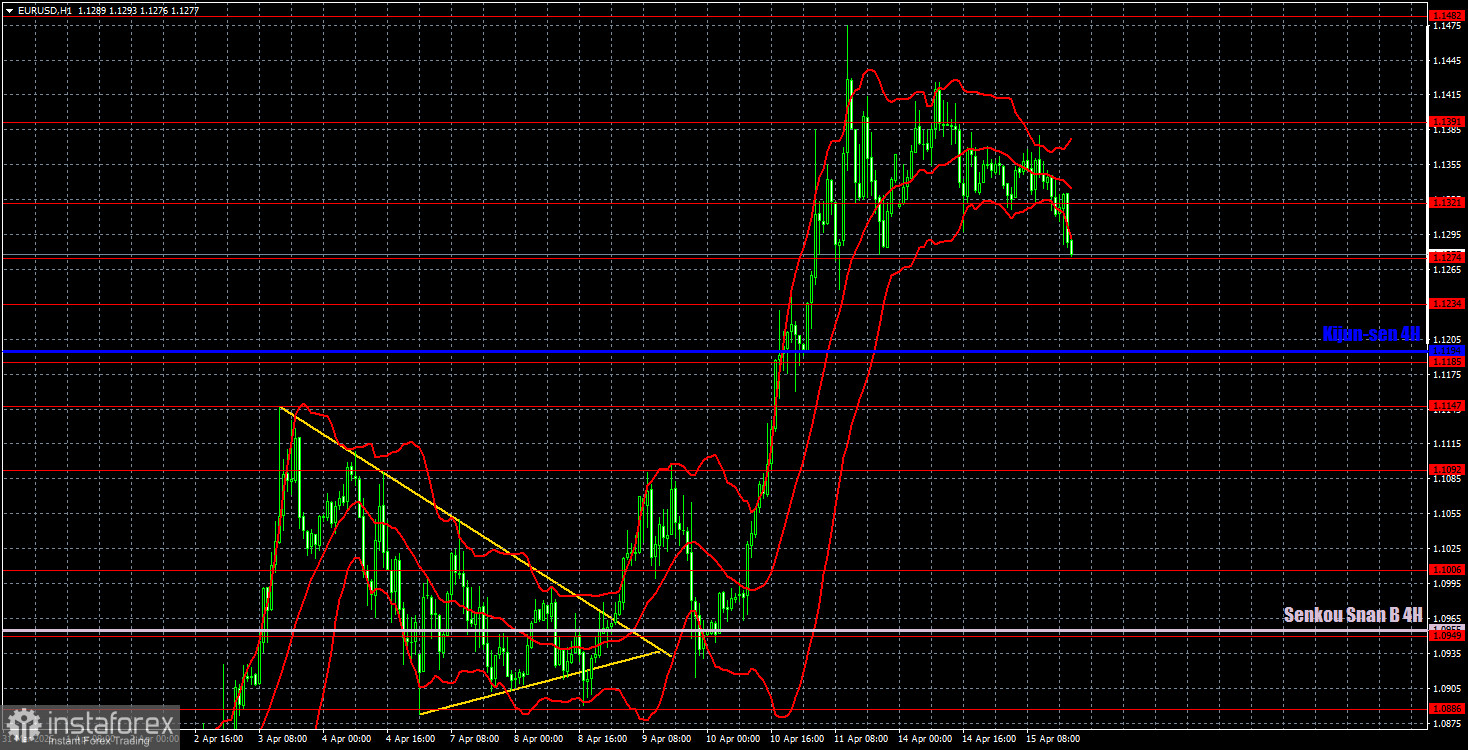
On the hourly chart, the EUR/USD pair quickly resumed upward movement when Trump introduced new tariffs. We believe the downtrend may resume in the medium term, but it's unclear how long the market will remain focused solely on the "Trump factor"—and where the pair will end up afterward. Currently, panic and chaos rule the markets, and nothing is certain. The dollar should at least see a modest correction from a technical perspective. But what if Trump raises tariffs on China tomorrow? Or announces the failure of talks with countries on the "preferential list"?
For April 16, we highlight the following trading levels: 1.0757, 1.0797, 1.0823, 1.0886, 1.0949, 1.1006, 1.1092, 1.1147, 1.1185, 1.1234, 1.1274, 1.1323, 1.1391, and 1.1482, along with the Senkou Span B line (1.0955) and Kijun-sen line (1.1194). Ichimoku indicator lines may shift throughout the day and should be monitored when identifying trade signals. Don't forget to set your Stop Loss to break even once the price moves 15 pips in the correct direction—this helps minimize potential losses if the signal turns out to be false.
On Wednesday, the Eurozone will release the second estimate of March inflation, which is objectively less significant than the first. Currently, the overall macroeconomic background means very little to the market. The U.S. will publish reports on retail sales and industrial production—but once again, it will all come down to Trump.
Illustration Explanations:
- Support and Resistance Levels (thick red lines): Thick red lines indicate where movement may come to an end. Please note that these lines are not sources of trading signals.
- Kijun-sen and Senkou Span B Lines: Ichimoku indicator lines transferred from the 4-hour timeframe to the hourly timeframe. These are strong lines.
- Extreme Levels (thin red lines): Thin red lines where the price has previously bounced. These serve as sources of trading signals.
- Yellow Lines: Trendlines, trend channels, or any other technical patterns.
- Indicator 1 on COT Charts: Represents the net position size for each category of traders.