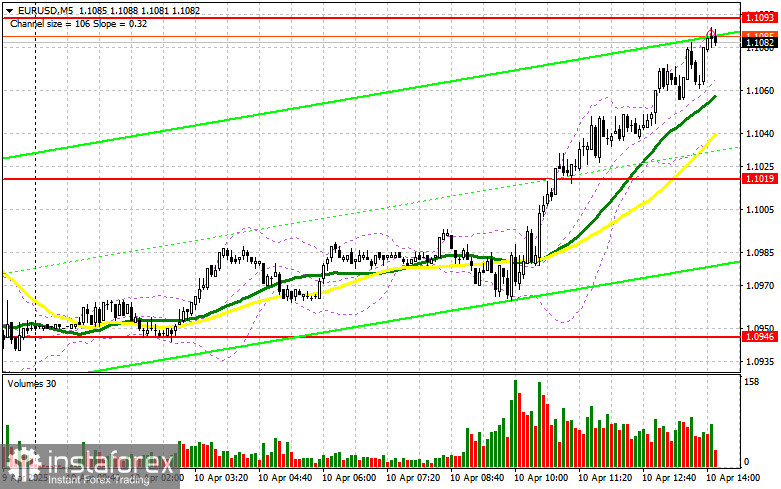
In my morning forecast, I drew attention to the 1.1019 level and planned to make market entry decisions based on it. Let's look at the 5-minute chart to understand what happened. The price did rise, but I didn't see either a false breakout at that level or a retest after a breakout, so I ended up with no trades. The technical picture was revised for the second half of the day.
To open long positions on EUR/USD:
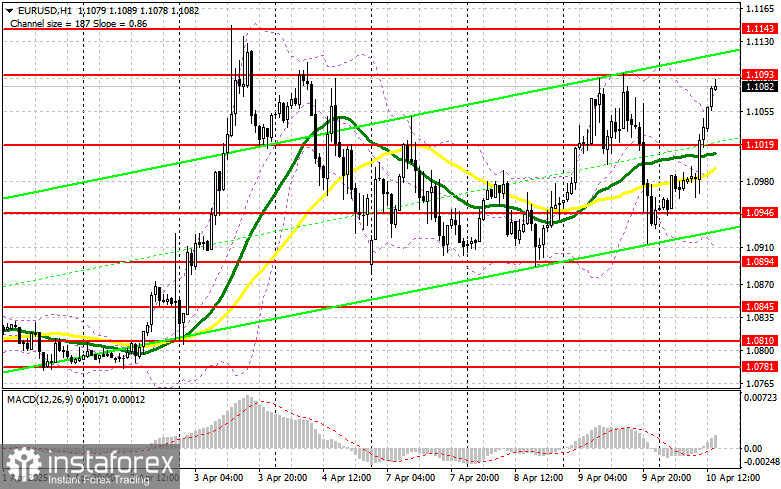
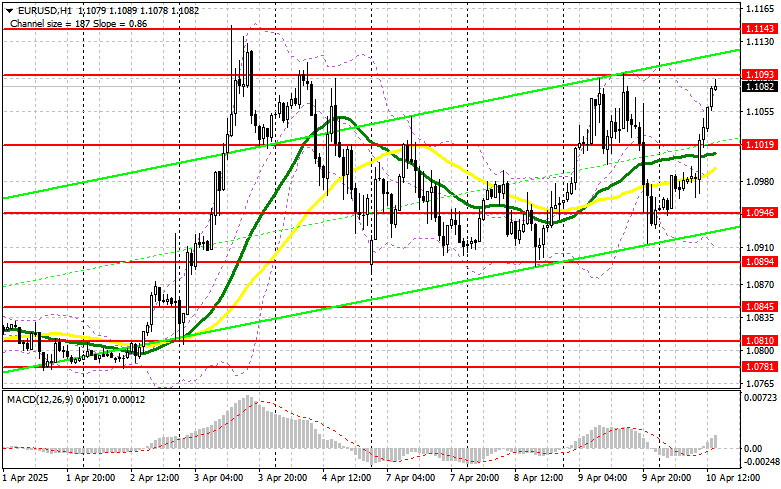
Despite the euro's active growth, driven by discussions within the EU about lifting tariffs previously imposed on the U.S., everything could quickly change in the second half of the day. We expect data on the U.S. Consumer Price Index (CPI) for March and the Core CPI excluding food and energy prices. Also, the weekly jobless claims report will be released. If inflation rises, pressure on the euro will return. In this case, only a false breakout near the 1.1019 support level would justify buying EUR/USD in anticipation of a bullish market recovery with a target of retesting 1.1093. A breakout and successful retest of this range would confirm a correct buy entry, with the next target at the 1.1143 level — last week's high. The furthest target would be 1.1179, where I plan to take profits. If EUR/USD declines and there is no activity near 1.1019, pressure on the euro will intensify, and the market will remain within the sideways channel. Bears will then likely push the pair down to 1.0946. Only after a false breakout at that level do I plan to buy the euro. I will consider opening long positions on a rebound from 1.0894 with an intraday correction target of 30–35 points.
To open short positions on EUR/USD:
If the U.S. inflation data indicates weakening price pressure, sellers will struggle to maintain control of the market. Only a false breakout around 1.1093 will provide an opportunity to enter short positions with a target at the 1.1089 support level, formed in the first half of the day. Slightly below this level are the moving averages, which currently support the bulls. Therefore, a breakout and consolidation below this range would present a good selling opportunity, targeting the 1.0946 level. The furthest downward target would be 1.0894, where I plan to take profits. In case of another upward movement in EUR/USD during the second half of the day and the absence of active bear actions near 1.1093, buyers may return to the weekly highs. In that case, I'll postpone short positions until testing the next resistance level of 1.1143. I'll sell from there only after a failed consolidation. I plan to open short positions on a rebound from 1.1179 with a downward correction target of 30–35 points.
In the Commitment of Traders (COT) Report dated April 1:
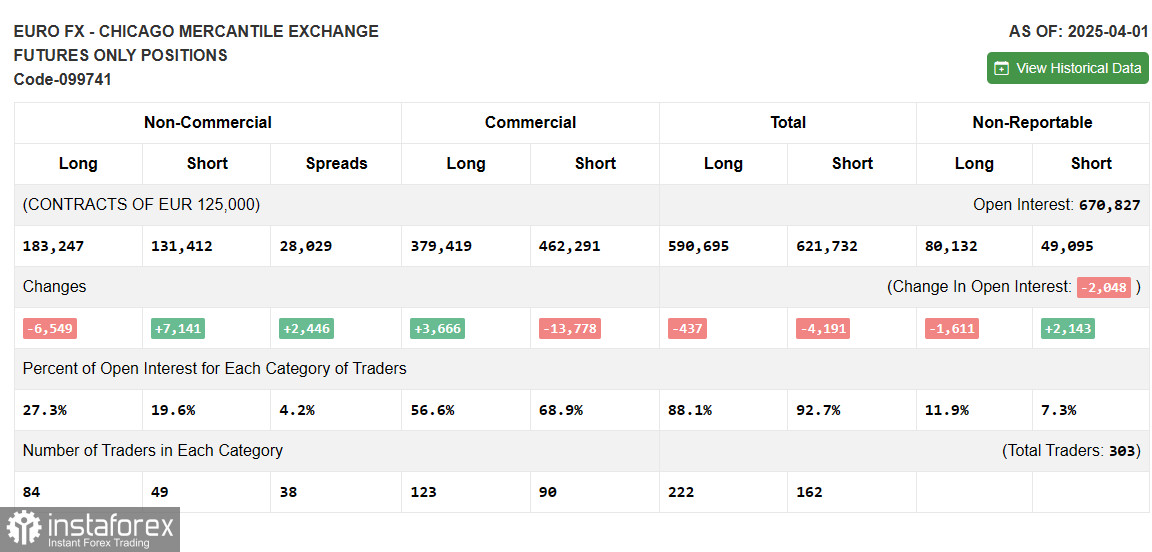
There was a slight increase in short positions and a reduction in long positions. However, it's important to understand that this report doesn't reflect the new U.S. trade tariffs on key partners, nor does it take into account the latest U.S. labor market data for March. Therefore, analyzing position dynamics in detail makes little sense, as it doesn't reflect current reality. The report indicates that non-commercial long positions decreased by 6,549 to 183,247, while short positions rose by 7,141 to 131,412. As a result, the gap between long and short positions increased by 2,466.
Indicator signals:
Moving Averages Trading is taking place above the 30- and 50-period moving averages, indicating control by euro buyers.
Note: The period and prices of moving averages are considered on the hourly chart (H1) and differ from the classic definitions on the daily chart (D1).
Bollinger Bands In the event of a decline, the lower band of the indicator around 1.0930 will act as support.
Indicator descriptions:
- Moving Average – Identifies the current trend by smoothing out volatility and noise.
- Period 50 (yellow on the chart)
- Period 30 (green on the chart)
- MACD Indicator (Moving Average Convergence/Divergence)
- Fast EMA – Period 12
- Slow EMA – Period 26
- Signal line (SMA) – Period 9
- Bollinger Bands – Period 20
- Non-commercial traders – Speculators such as individual traders, hedge funds, and large institutions using the futures market for speculative purposes.
- Non-commercial long positions – Total long open positions held by non-commercial traders.
- Non-commercial short positions – Total short open positions held by non-commercial traders.
- Net non-commercial position – The difference between short and long positions of non-commercial traders.