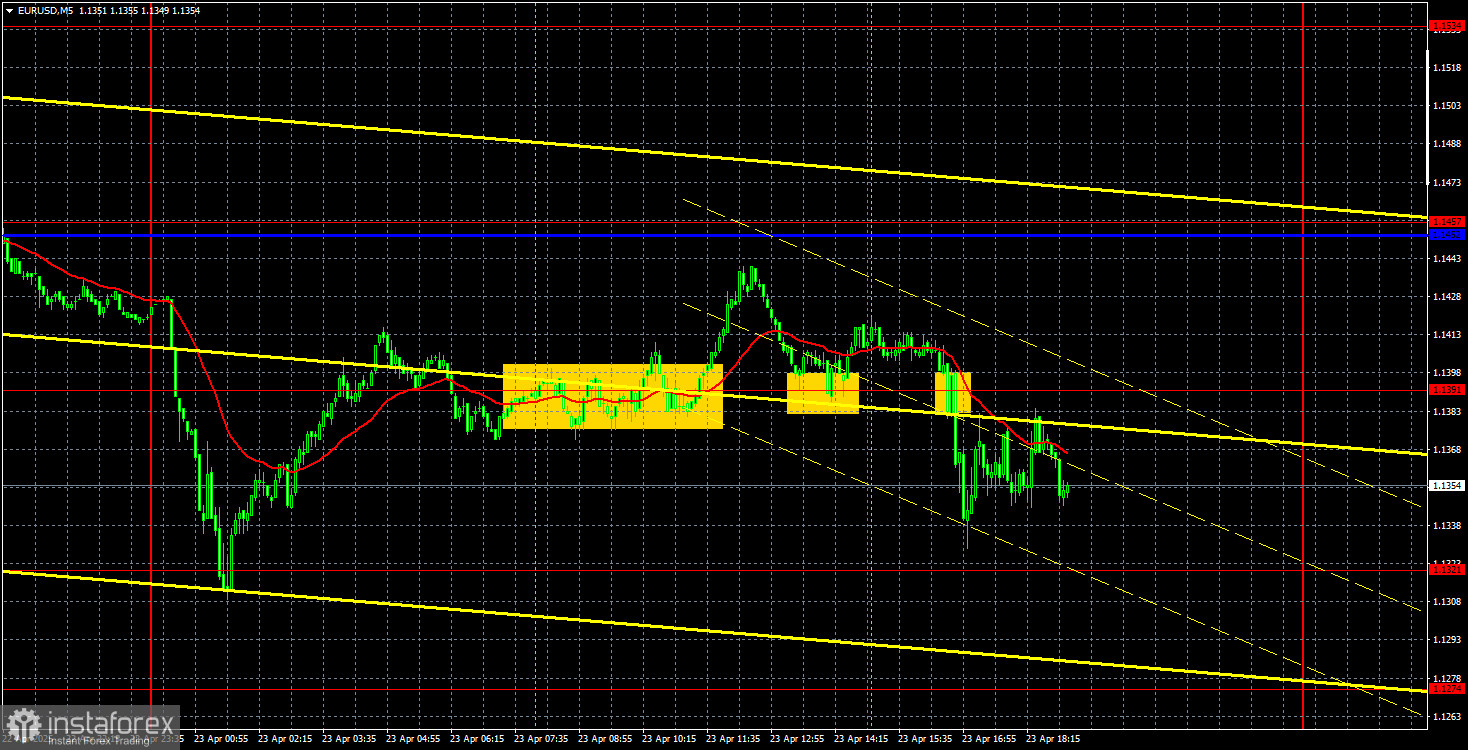
EUR/USD 5-Minute Analysis
The EUR/USD currency pair traded in both directions throughout Wednesday, constantly changing its trajectory. The trading day began with a price collapse following Donald Trump's announcement that he would not be firing Jerome Powell. We'll skip over the fact that Trump has no authority to dismiss Powell. Nevertheless, the market responded to this statement by buying the dollar. Trump also said that tariffs on Chinese imports would not remain at 145% and would be significantly lower. Traders interpreted this message as positive for the U.S. dollar.
However, the dollar's celebration didn't last long. Overnight, the price reversed upward and retraced just as much as it had dropped a few hours prior. Then came a sideways range and a slight decline by the end of the day. There was no logic or consistency in these moves. The euro inexplicably rose despite weak business activity indexes in the EU and Germany. After weak business activity indexes from the U.S., the dollar fell. In other words, the market's response to macroeconomic data lacked logic—pure randomness and chaos.
On the 5-minute chart, we highlighted several trade signals—but did so mainly for formality. The pair not only changed direction throughout the day but also altered the nature of its movement: from collapse to strong growth to flat. That's why we emphasize that the current price action is extremely chaotic. If there are no headlines from Trump, the price can move however it wants. Since Trump's announcements are impossible to predict, there's no practical use in understanding this factor.
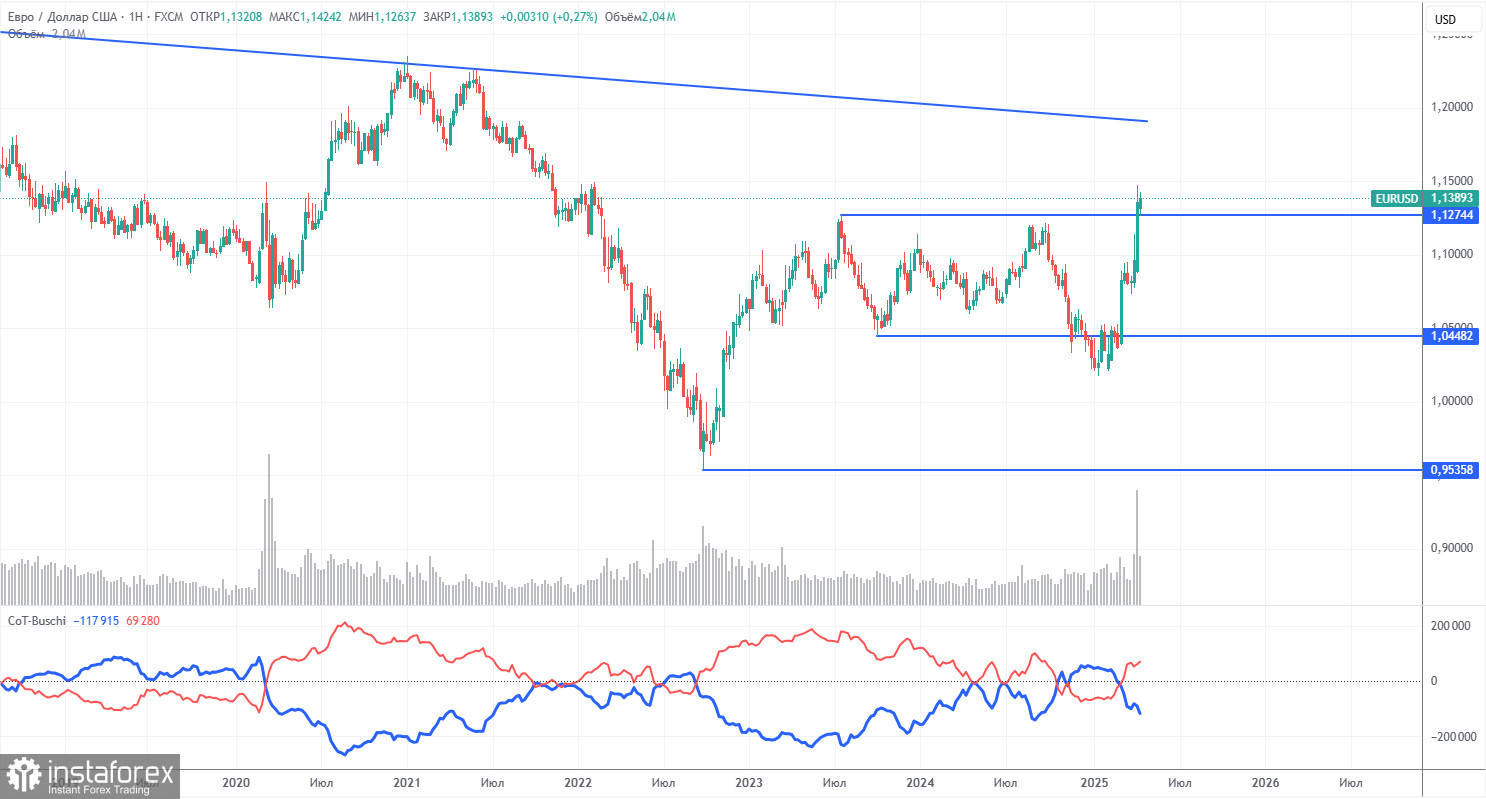
COT Report
The latest COT report is dated April 15. The chart above clearly shows that the net position of non-commercial traders had long remained bullish. Bears barely managed to gain the upper hand but quickly lost it again. The bears' advantage has visibly diminished since Trump took office, and the dollar sharply declined. We cannot definitively say that the decline of the U.S. currency will continue, but COT reports reflect the sentiment of large players—which can change rapidly under the current circumstances.
We still see no fundamental factors justifying euro strength, but one significant factor is now driving dollar weakness. The pair may continue to correct for several more weeks or months, but a 16-year downtrend won't reverse so easily.
The red and blue lines have now crossed again, signaling a bullish trend in the market. During the latest reporting week, the "Non-commercial" group increased its long positions by 6,800 and reduced its short positions by 2,500, resulting in a net increase of 9,300 contracts.
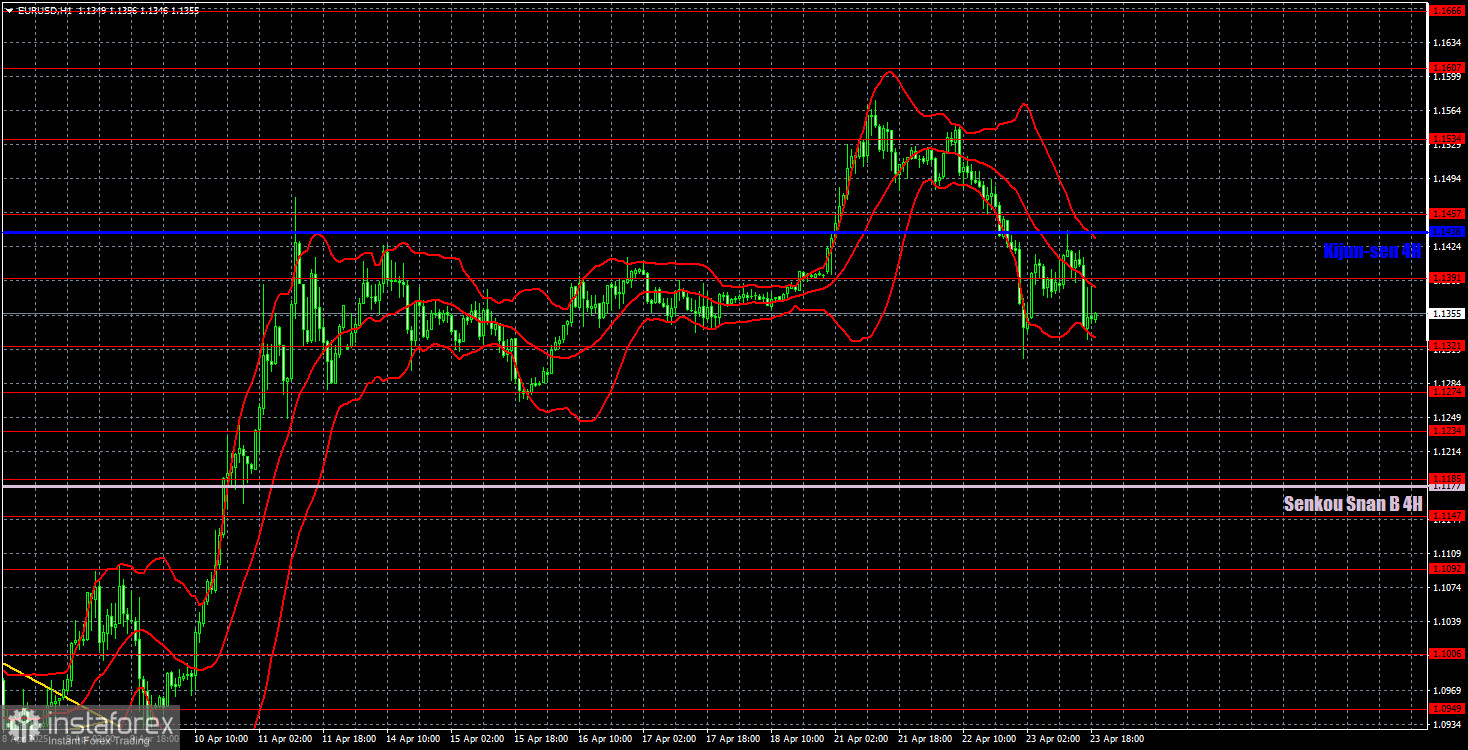
EUR/USD 1-Hour Analysis
On the hourly timeframe, the EUR/USD pair maintains a bullish trend despite no clear trend lines or channels. On the daily timeframe, it can be officially said that the long-term downtrend has been canceled. That would never have happened if Trump hadn't started a trade war. Thus, the fundamental backdrop has completely broken the technical structure—something that rarely happens, but it does happen. Unfortunately, this uptrend can end just as abruptly and unexpectedly if Trump stops imposing tariffs and chooses de-escalation. The market currently lacks technical logic across all timeframes.
For April 24, we highlight the following trading levels: 1.0823, 1.0886, 1.0949, 1.1006, 1.1092, 1.1147, 1.1185, 1.1234, 1.1274, 1.1321, 1.1391, 1.1474, 1.1607, 1.1666, as well as the Senkou Span B line (1.1177) and the Kijun-sen line (1.1438). Remember that the Ichimoku indicator lines may shift throughout the day, which must be considered when interpreting trading signals. Don't forget to move your Stop Loss to breakeven if the price moves 15 pips in the right direction—this helps protect against losses from false signals.
The U.S. will publish reports on new home sales and durable goods orders on Thursday. These are the only relatively important releases that could trigger a market reaction. However, the price may continue shifting direction unpredictably, and the "Trump factor" is still in play. The market remains in a state of chaos.
Illustration Explanations:
- Support and Resistance Levels (thick red lines): Thick red lines indicate where movement may come to an end. Please note that these lines are not sources of trading signals.
- Kijun-sen and Senkou Span B Lines: Ichimoku indicator lines transferred from the 4-hour timeframe to the hourly timeframe. These are strong lines.
- Extreme Levels (thin red lines): Thin red lines where the price has previously bounced. These serve as sources of trading signals.
- Yellow Lines: Trendlines, trend channels, or any other technical patterns.
- Indicator 1 on COT Charts: Represents the net position size for each category of traders.