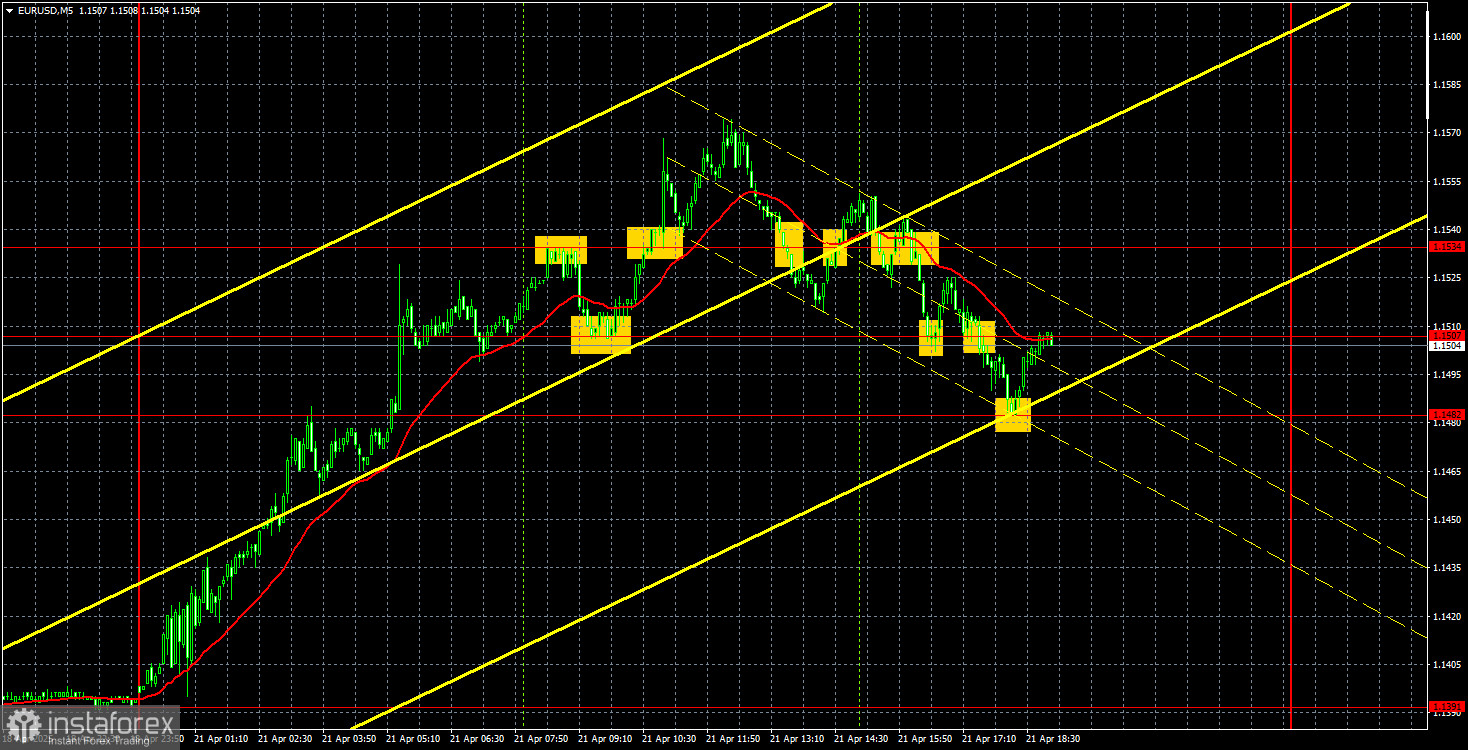
EUR/USD 5-Minute Analysis
The EUR/USD currency pair shot up again on Monday—straight to the moon. This time, the euro gained a "modest" 150 pips in a single day, even though no macroeconomic reports were released in either the Eurozone or the U.S. and no globally significant news. Even Donald Trump refrained from introducing new tariffs, sanctions, threats, or ultimatums over the weekend and Monday. As such, predicting another surge in EUR/USD was impossible. However, we've often said that the dollar can collapse any day. For example, the pound sterling rose all of last week—even when there was no noteworthy news or events. This is the market's current policy: "Sell the Dollar."
There's no point in identifying technical patterns or formations in the hourly timeframe because there are none. We're not dealing with a classic trend where occasional corrections or pullbacks occur. It's impossible to draw a trendline or a channel based on this movement. The dollar can collapse at any moment, as it did on Monday. If Trump begins introducing or raising tariffs again, the dollar's fate will be sealed.
A relatively large number of trading signals were formed on Monday. Price respected technical levels fairly well. Unfortunately, there were many reversals, so we won't list all the signals in the chart above. Let's say that when the price moves 180 pips on a "quiet Monday," such a move can hardly be called technical, logical, or expected.
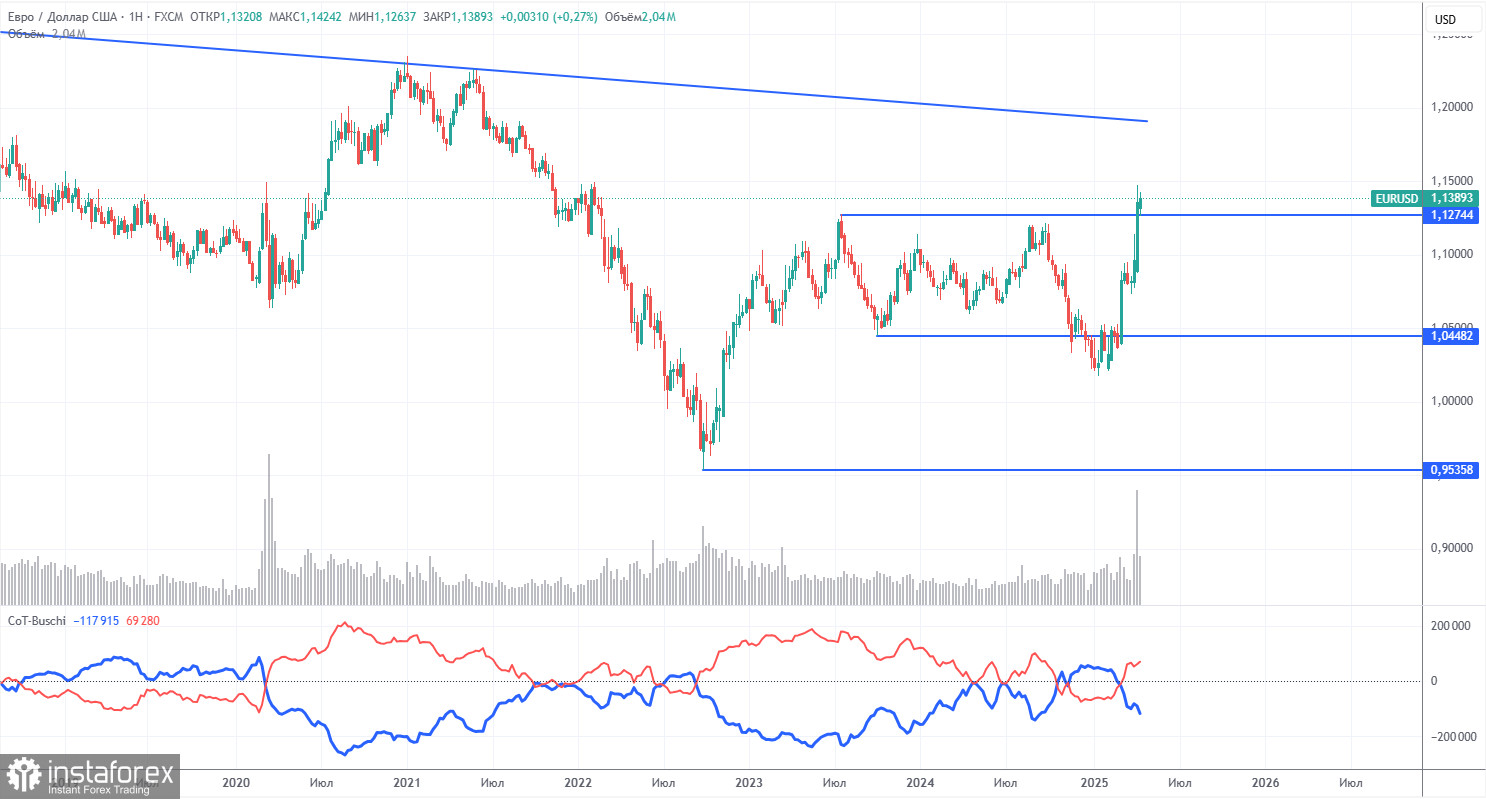
COT Report
The latest COT report is dated April 15. The chart above clearly shows that the net position of non-commercial traders had long remained bullish. Bears barely managed to gain the upper hand but quickly lost it again. The bears' advantage has visibly diminished since Trump took office, and the dollar sharply declined. We cannot definitively say that the decline of the U.S. currency will continue, but COT reports reflect the sentiment of large players—which can change rapidly under the current circumstances.
We still see no fundamental factors justifying euro strength, but one significant factor is now driving dollar weakness. The pair may continue to correct for several more weeks or months, but a 16-year downtrend won't reverse so easily.
The red and blue lines have now crossed again, signaling a bullish trend in the market. During the latest reporting week, the "Non-commercial" group increased its long positions by 6,800 and reduced its short positions by 2,500, resulting in a net increase of 9,300 contracts.
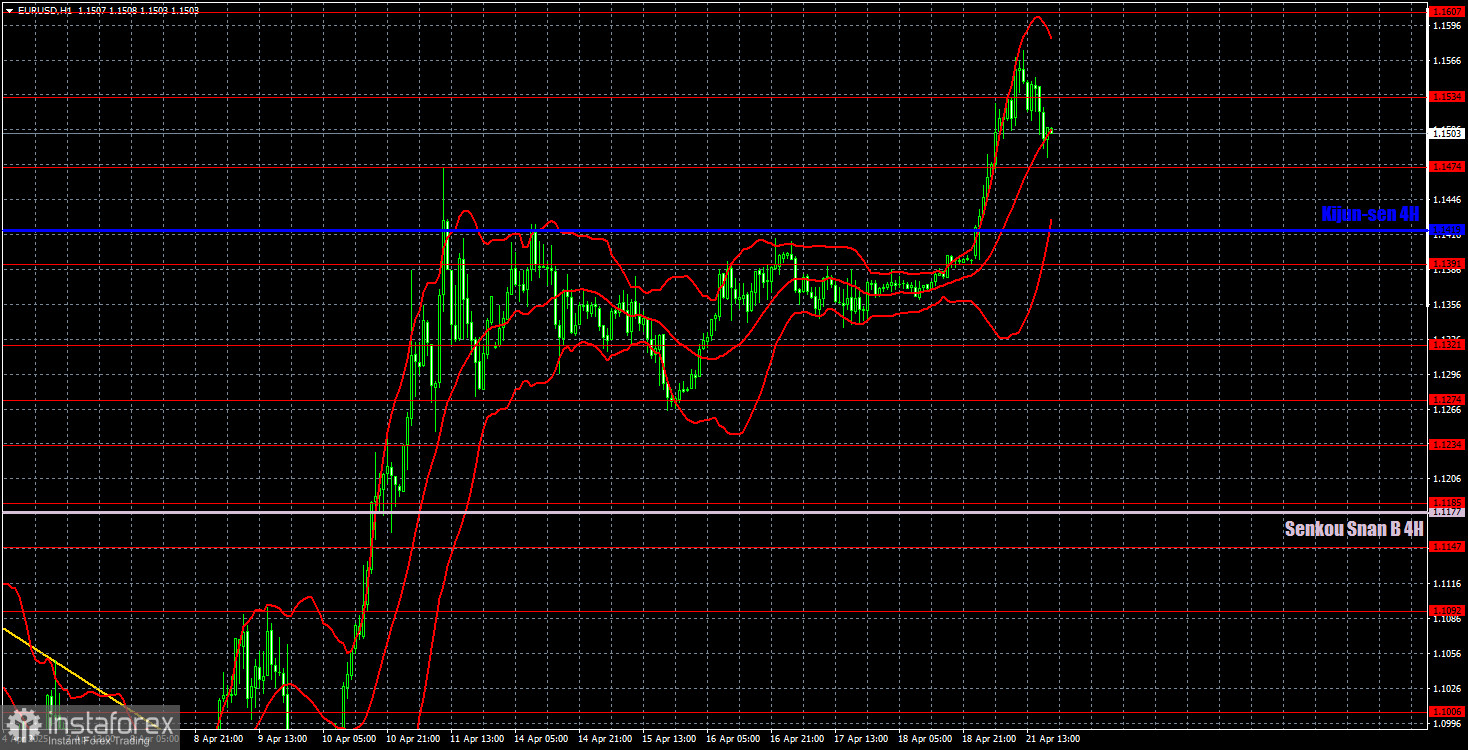
EUR/USD 1-Hour Analysis
On the hourly timeframe, the EUR/USD pair resumed its upward movement even without new tariffs from the U.S. president. On the daily timeframe, it's now officially safe to say that the downtrend has ended. This would never have happened if Trump hadn't started the trade war. As a result, the fundamental background has broken the technical picture—something that doesn't happen often, but it does happen. Unfortunately, the uptrend could also end sharply and unexpectedly if Trump stops imposing tariffs and moves toward de-escalation. So we can't be 100% confident that the growth will continue.
For April 22, we identify the following trading levels: 1.0823, 1.0886, 1.0949, 1.1006, 1.1092, 1.1147, 1.1185, 1.1234, 1.1274, 1.1321, 1.1391, 1.1474, 1.1607, 1.1666, as well as the Senkou Span B (1.1177) and Kijun-sen (1.1419) lines. The Ichimoku indicator lines may move during the day, which should be considered when determining trading signals. Don't forget to place a Stop Loss at breakeven if the price moves 15 pips in the right direction. This helps protect against possible losses if the signal turns out to be false.
No important events or reports are scheduled on Tuesday in the Eurozone or the U.S. However, last week showed that major events no longer guarantee any movement or reaction in the market. Monday proved that a powerful move can happen even without any news, so be prepared for anything.
Illustration Explanations:
- Support and Resistance Levels (thick red lines): Thick red lines indicate where movement may come to an end. Please note that these lines are not sources of trading signals.
- Kijun-sen and Senkou Span B Lines: Ichimoku indicator lines transferred from the 4-hour timeframe to the hourly timeframe. These are strong lines.
- Extreme Levels (thin red lines): Thin red lines where the price has previously bounced. These serve as sources of trading signals.
- Yellow Lines: Trendlines, trend channels, or any other technical patterns.
- Indicator 1 on COT Charts: Represents the net position size for each category of traders.