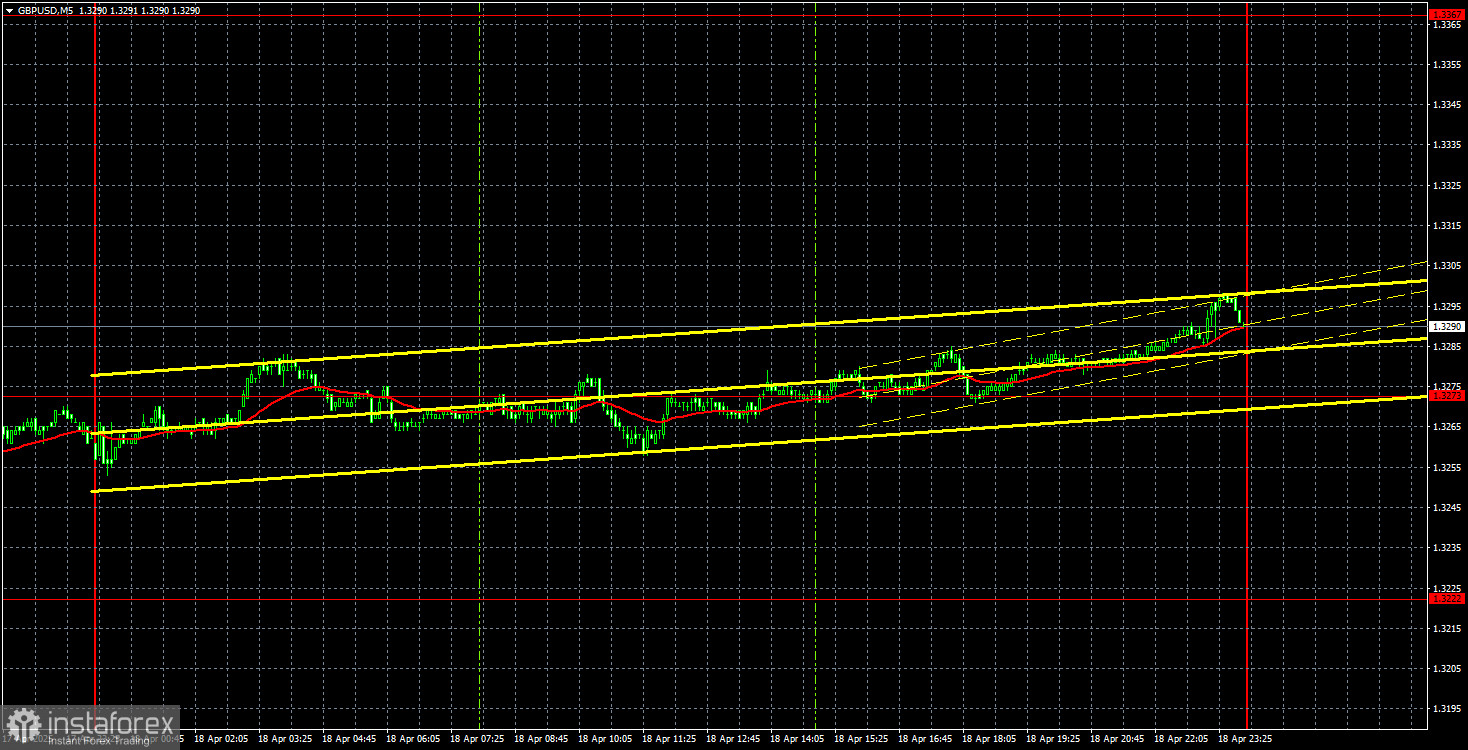
GBP/USD 5-Minute Analysis
The GBP/USD currency pair traded higher again on Friday, albeit with minimal volatility. Despite the lack of important events in the U.S. or the U.K. that day (unlike earlier in the week), the market steadily pushed the British pound upward. Volatility has been declining almost daily, indicating lower trader activity—yet the pair keeps moving north with persistence that deserves applause.
The technical picture for the British pound (as well as for many other currency pairs) remains very simple and very complicated simultaneously. Everything depends on Trump and his decisions regarding the trade war. If new tariffs are introduced, the dollar will fall again. However, even last week, when no new tariffs were announced, the U.S. currency still declined. Thus, it's extremely difficult to say what might save the dollar right now. There are no signs of de-escalation in the trade conflict, and the market ignores any positive factors for the dollar.
The price crossed the 1.3273 level several times on Friday, but I spent most of the day in a holiday flat. As we've mentioned, market movements are currently highly illogical, and nothing has changed—especially in conditions of flat movement and low volatility.
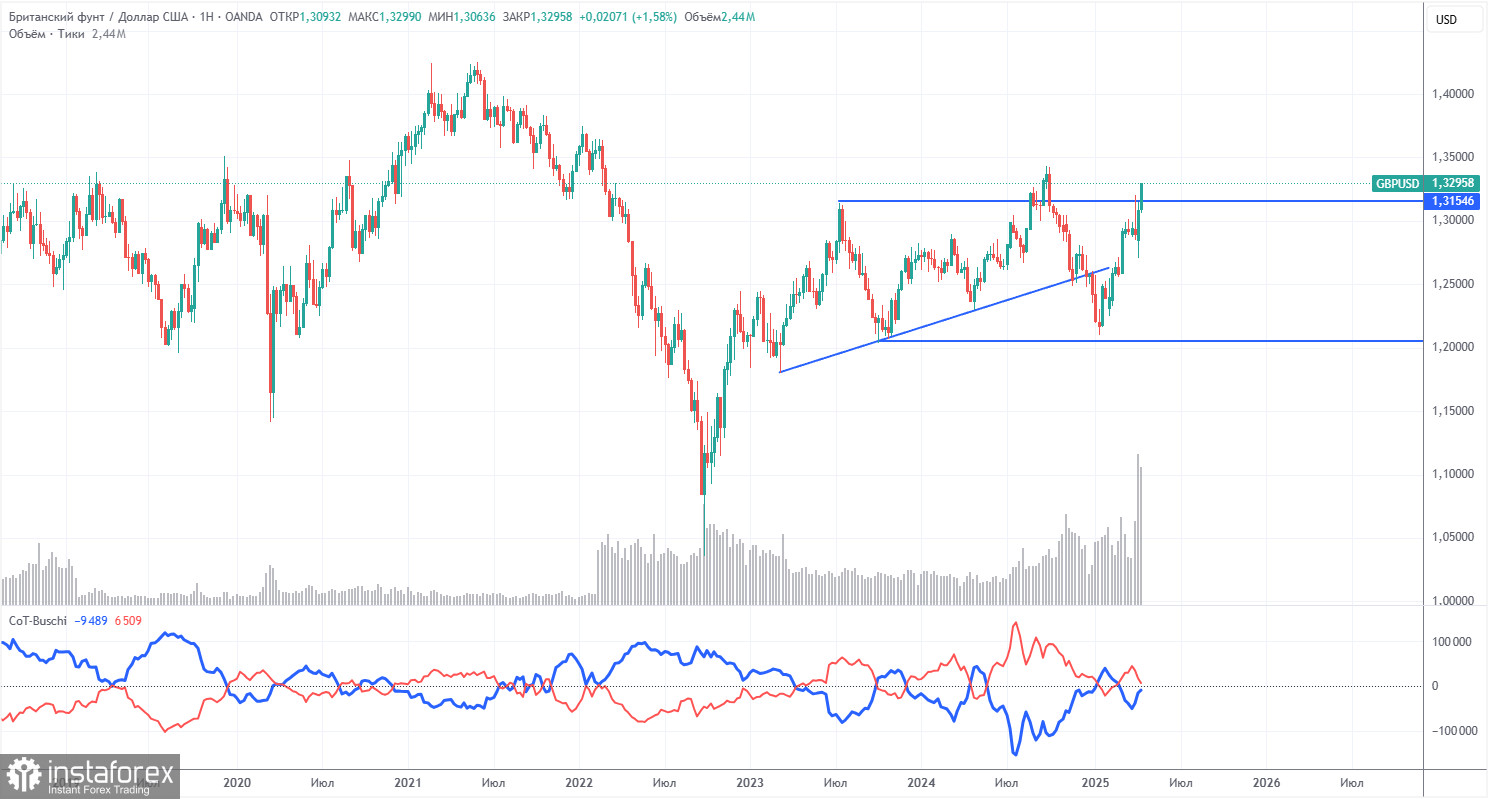
COT Report
COT (Commitments of Traders) reports on the British pound show that sentiment among commercial traders has been constantly shifting over recent years. The red and blue lines, representing net positions of commercial and non-commercial traders, frequently intersect and are usually close to the zero mark. This is still the case now, which indicates a roughly equal number of long and short positions.
On the weekly timeframe, the price first broke through the 1.3154 level, then overcame the trendline, returned to 1.3154, and broke it again. The breach of the trendline would typically suggest a high likelihood of further pound declines. However, we continue to see the dollar falling due to Donald Trump. Therefore, trade war news may keep pushing the pound even higher, regardless of the technical picture.
According to the latest COT report on the British pound, the "Non-commercial" group closed 6,000 BUY contracts and opened 4,700 SELL contracts. As a result, the net position of non-commercial traders has declined for the third consecutive week (-10,700 contracts), yet this hasn't had any meaningful impact on price movement.
The fundamental background still doesn't support long-term buying of the British pound, and the currency has realistic chances of continuing its long-term downtrend. The pound has risen sharply in recent months, but the reason is apparent: Trump's policy actions.
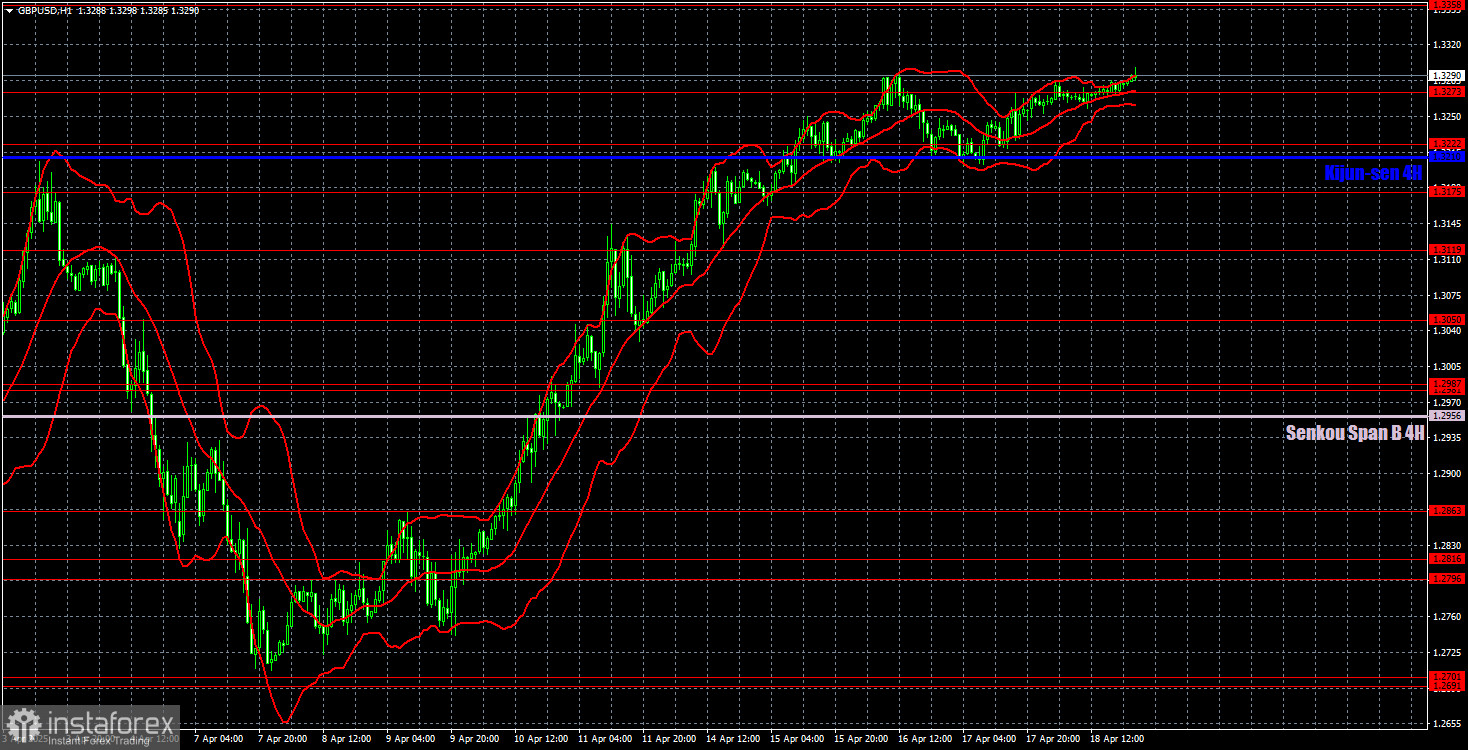
GBP/USD 1-Hour Analysis
On the hourly timeframe, the GBP/USD pair has shown a strong rally following nearly a month of sideways movement, an even stronger crash, and now another rally. The pound is rising again, although this has little to do with the pound itself. The entire upward movement results from a weakening dollar triggered by Trump. And this has not ended yet. Therefore, the market's chaos, panic, and lack of logic continue to dominate.
For April 21, we highlight the following key levels: 1.2511, 1.2605–1.2620, 1.2691–1.2701, 1.2796–1.2816, 1.2863, 1.2981–1.2987, 1.3050, 1.3119, 1.3175, 1.3222, 1.3273, 1.3358. The Senkou Span B line (1.2956) and the Kijun-sen line (1.3210) may also serve as signal sources. Setting a Stop Loss to break even after the price moves 20 pips in the correct direction is recommended. Ichimoku indicator lines may shift throughout the day and should be considered when determining signals.
No significant events or reports are scheduled in the U.K. or U.S. on Monday. Since the pound has recently calmed down noticeably, we can likely expect low volatility today. Nevertheless, the pair may still lean toward growth.
Illustration Explanations:
- Support and Resistance Levels (thick red lines): Thick red lines indicate where movement may come to an end. Please note that these lines are not sources of trading signals.
- Kijun-sen and Senkou Span B Lines: Ichimoku indicator lines transferred from the 4-hour timeframe to the hourly timeframe. These are strong lines.
- Extreme Levels (thin red lines): Thin red lines where the price has previously bounced. These serve as sources of trading signals.
- Yellow Lines: Trendlines, trend channels, or any other technical patterns.
- Indicator 1 on COT Charts: Represents the net position size for each category of traders.